这里涉及到几个问题。首先,HoloViews 中的选项取决于您选择的绘图库后端,如 bokeh、matplotlib 或 plotly。在您的代码示例中,您尚未加载绘图库后端,因此无法获得任何关于 legend_position 等绘图选项的帮助。当然,您不应该得到像 AttributeError 这样的错误消息,请在 https://github.com/holoviz/holoviews/issues 提交问题以帮助我们复制该虚假消息。当我运行没有加载绘图库后端的 hv.help(hv.Curve) 时,我并没有看到任何错误消息;而是得到了 Sander 报告的一个简短的列表,其中列出的选项与绘图无关,应该始终可用,无论使用哪种后端。
$ python
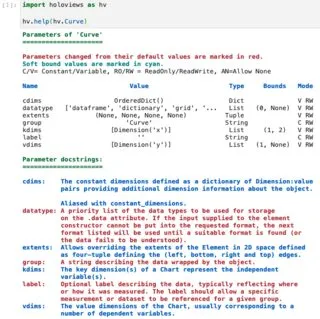
>>> import holoviews as hv
>>> hv.help(hv.Curve)
Parameters of 'Curve'
=====================
Parameters changed from their default values are marked in red.
Soft bound values are marked in cyan.
C/V= Constant/Variable, RO/RW = ReadOnly/ReadWrite, AN=Allow None
Name Value Type Bounds Mode
cdims OrderedDict() Dict V RW
datatype ['dataframe', 'dictionary', 'grid', '... List (0, None) V RW
extents (None, None, None, None) Tuple V RW
group 'Curve' String C RW
kdims [Dimension('x')] List (1, 2) V RW
label '' String C RW
vdims [Dimension('y')] List (1, None) V RW
Parameter docstrings:
=====================
cdims: The constant dimensions defined as a dictionary of Dimension:value
pairs providing additional dimension information about the object.
...
vdims: The value dimensions of the Chart, usually corresponding to a
number of dependent variables.
正如您所见,这7个选项在这种情况下都没有帮助。如果加载一个绘图后端,您将获得更多的选项:
>>> hv.extension("bokeh")
>>> hv.help(hv.Curve)
Curve

Online example: http://holoviews.org/reference/elements/bokeh/Curve.html

-------------
Style Options
-------------

    alpha, color, hover_alpha, hover_color, hover_line_alpha, hover_line_color, line_alpha, line_cap, line_color, line_dash, line_join, line_width, muted, muted_alpha, muted_color, muted_line_alpha, muted_line_color, nonselection_alpha, nonselection_color, nonselection_line_alpha, nonselection_line_color, selection_alpha, selection_color, selection_line_alpha, selection_line_color, visible

(Consult bokeh's documentation for more information.)

------------
Plot Options
------------

The plot options are the parameters of the plotting class:

Parameters of 'CurvePlot'
=========================

Parameters changed from their default values are marked in red.
Soft bound values are marked in cyan.
C/V= Constant/Variable, RO/RW = ReadOnly/ReadWrite, AN=Allow None

Name                                 Value                         Type         Bounds     Mode

active_tools                           []                          List       (0, None)    V RW
... 57 other options...
zlim                               (nan, nan)                     Tuple                    V RW

Parameter docstrings:
=====================

active_tools:      Allows specifying which tools are active by default. Note
                   that only one tool per gesture type can be active, e.g.
                   both 'pan' and 'box_zoom' are drag tools, so if both are
                   listed only the last one will be active.
... 57 other options...
zlim:              User-specified z-axis range limits for the plot, as a tuple (low,high).
                   If specified, takes precedence over data and dimension ranges.
这里只列出了"style"选项,没有详细说明,因为它们直接传递给底层绘图库,所以无法在此处记录; 在这种情况下,请参阅 Bokeh。其他选项具有文档字符串,因为它们由 HoloViews 实现。
即使这样,如果您查看输出,您会注意到legend_position实际上并不在任何一个列表中。这是因为legend_position不是hv.Curve的选项,而是hv.Overlay的选项,后者是用于叠加的通用容器(包括曲线和许多其他对象)。因此,您需要对 Overlay 类执行hv.help:
>>> hv.help(hv.Overlay)
Overlay

Online example: http://holoviews.org/reference/containers/bokeh/Overlay.html

-------------
Style Options
-------------

    background_fill_alpha, background_fill_color, border_alpha, border_color, border_hover_alpha, border_hover_color, border_hover_line_alpha, border_hover_line_color, border_line_alpha, border_line_cap, border_line_color, border_line_dash, border_line_join, border_line_width, border_muted_alpha, border_muted_color, border_muted_line_alpha, border_muted_line_color, border_nonselection_alpha, border_nonselection_color, border_nonselection_line_alpha, border_nonselection_line_color, border_selection_alpha, border_selection_color, border_selection_line_alpha, border_selection_line_color, click_policy, glyph_height, glyph_width, label_height, label_standoff, label_width, legend_padding, legend_spacing, text_align, text_alpha, text_baseline, text_color, text_font, text_font_size, text_font_style

(Consult bokeh's documentation for more information.)

------------
Plot Options
------------

The plot options are the parameters of the plotting class:

Parameters of 'OverlayPlot'
===========================

Parameters changed from their default values are marked in red.
Soft bound values are marked in cyan.
C/V= Constant/Variable, RO/RW = ReadOnly/ReadWrite, AN=Allow None

Name                                 Value                         Type         Bounds     Mode

active_tools                           []                          List       (0, None)    V RW
...66 more options...
zlim                               (nan, nan)                     Tuple                    V RW

Parameter docstrings:
=====================

active_tools:      Allows specifying which tools are active by default.
...
legend_position:   Allows selecting between a number of predefined legend position
                   options. The predefined options may be customized in the
                   legend_specs class attribute.
...
所以你可以看到,legend_position是一个选项,但最终仍然没有告诉你什么是允许的。令人沮丧!在许多情况下,您可以在Jupyter中输入部分内容并调用tab完成,但在这种带有字符串参数的情况下,最好的方法是提供一个不正确的值。如果您在Jupyter中这样做,您将得到一个允许选项的列表:
>>> hv.Overlay().opts(hv.opts.Overlay(legend_position='aslkjf'))
ValueError: aslkjf not in Parameter legend_position's list of possible objects, valid options include [top_right, top_left, bottom_left, bottom_right, right, left, top, bottom]
有很多信息可供使用,但很难找到它!
hv.help函数以便我们可以在带有参数的对象上调用它并获取预期的表达式是否会很复杂?例如(hv.help(hv.Overlay,option='legend_position'))。这对于绘图样式选项也可能非常有用。 - lhoupert