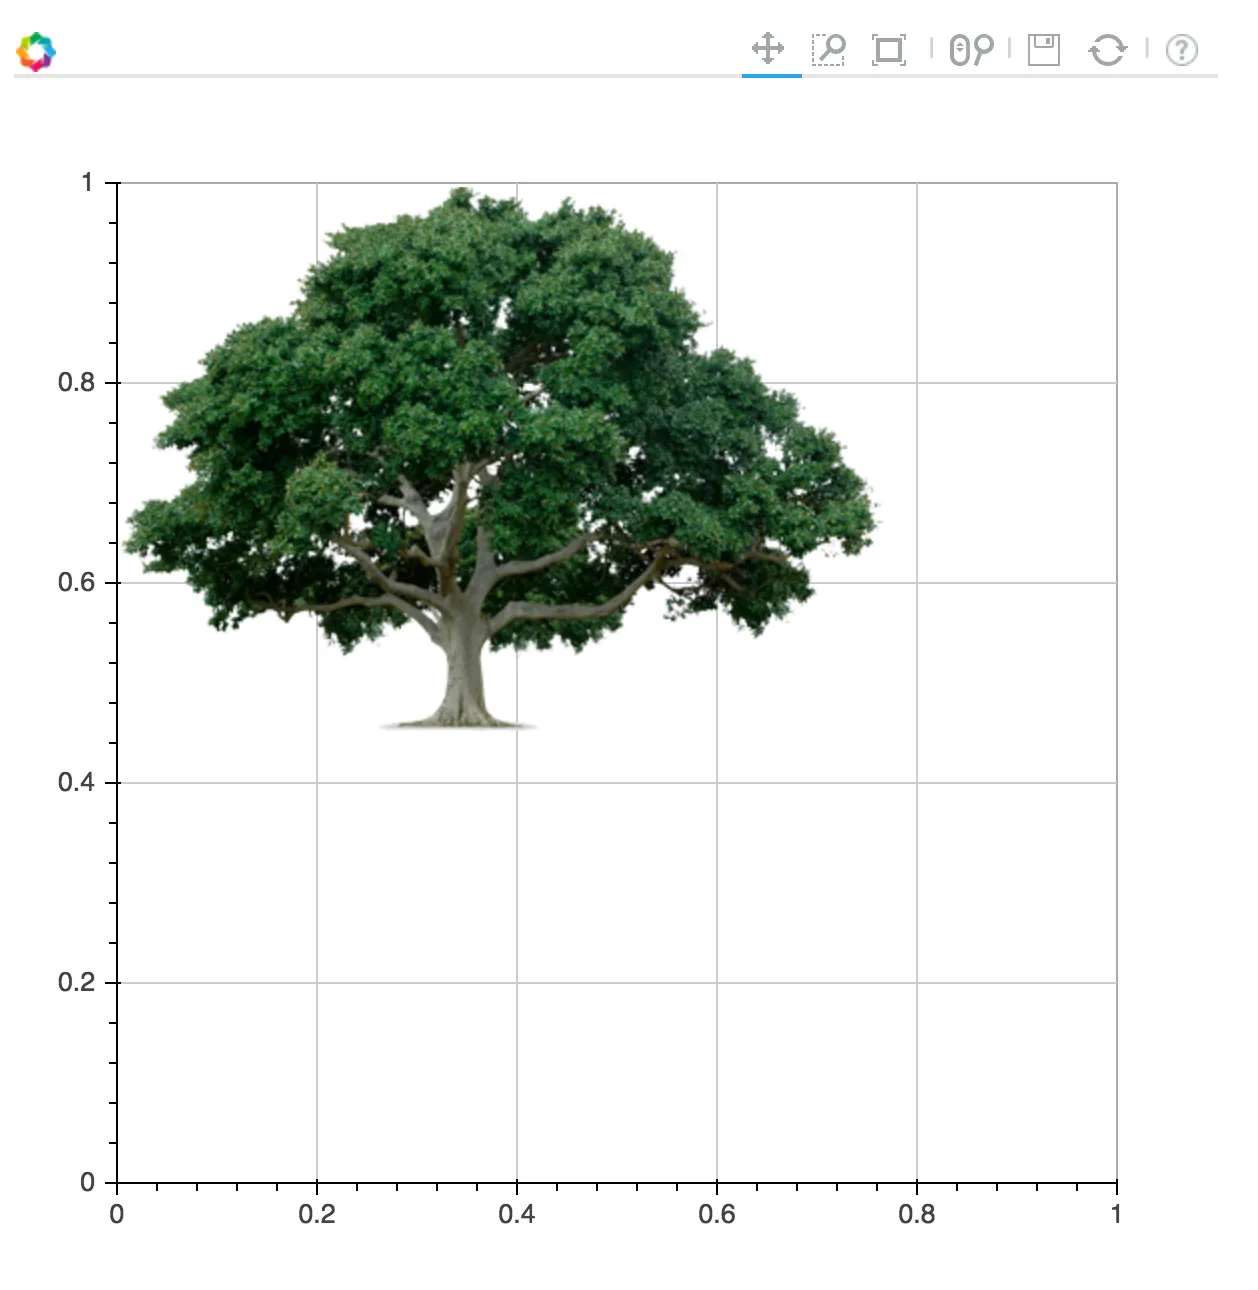
例如,您可以使用以下代码在matplotlib中绘制图像:
例如,您可以使用以下代码在matplotlib中绘制图像:
%matplotlib inline
import matplotlib.pyplot as plt
import matplotlib.image as mpimg
img=mpimg.imread('image.png')
plt.imshow(img)
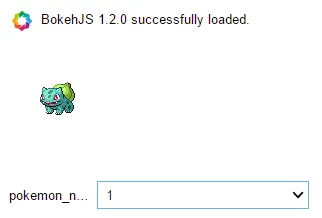
Bokeh(0.10)可以做到类似这样的事情吗?

Image(标量数据,用于颜色映射),ImageRGBA(原始RGBA数据)和ImageURL(通过网络加载的图像)。这将是在GitHub问题跟踪器上提出的一个很好的功能请求。 - bigreddot