考虑以下数据框示例。
我正在使用 R 包 formattable 制作漂亮的表格。
df <- data.frame(
  id = 1:4,
  name = c("Bob", "Ashley", "James", "David"),
  age = c(48, NA, 40, 28),
  test1_score = c(18.9, 19.5, NA, 12.9),
  stringsAsFactors = FALSE)
我正在使用 R 包 formattable 制作漂亮的表格。
library(formattable)
formattable(df, list(
age = color_tile("white", "orange"),
test1_score = color_bar("pink", 'proportion', 0.2)
))
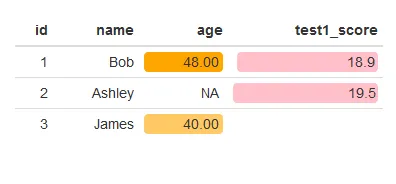
df[is.na(df)]=''
formattable(df, list(
  age = color_tile("white", "orange"),
  test1_score = color_bar("pink", 'proportion', 0.2)
))
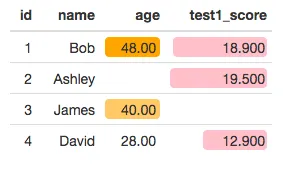
df$age = digits(df$age, digits=2)
formattable(df, list(
age = color_tile("white", "orange"),
test1_score = color_bar("pink", 'proportion', 0.2)
))
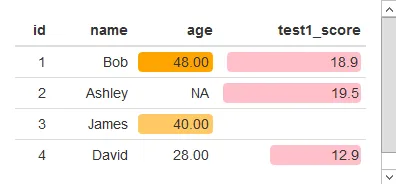
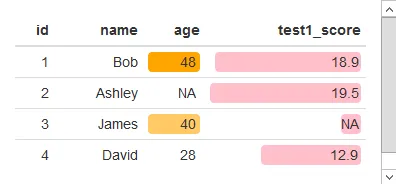
df[is.na(df)] = ''
formattable(df, list(
age = color_tile("white", "orange"),
test1_score = color_bar("pink", 'proportion', 0.2)
))

df$age 转换为一个 可格式化的数字 对象并创建了 NA,而 df[is.na(df)] = '' 将 df$age 转换为一个 可格式化的字符 对象:> df$age = digits(df$age, digits=2)
> df$age
[1] 48.00 NA 40.00 28.00
> class(df$age)
[1] "formattable" "numeric"
> df[is.na(df)] = ''
> df$age
[1] "48" " " "40" "28"
> class(df$age)
[1] "formattable" "character"
有关解决方案的任何想法吗?
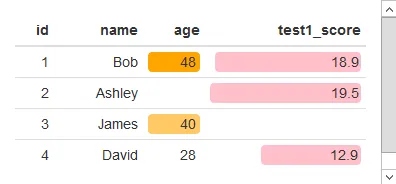
最终,我还想将其与过滤后的数据框一起使用,我使用 使用formattable过滤数据框中的代码来确保在过滤数据框时颜色比例尺保持不变:
df$age = digits(df$age, digits=2)
  subset_df <- function(m) {
    formattable(df[m, ], list(
      age = x ~ color_tile("white", "orange")(df$age)[m],
      test1_score = x ~ color_bar("pink", 'proportion', 0.2)(df$test1_score)[m],
      test2_score = x ~ color_bar("pink", 'proportion', 0.2)(df$test2_score)[m]
    ))
  }

subset_df(1:3)