R闪亮的点表格刷子空白NA行。

4
我正在开发一个使用
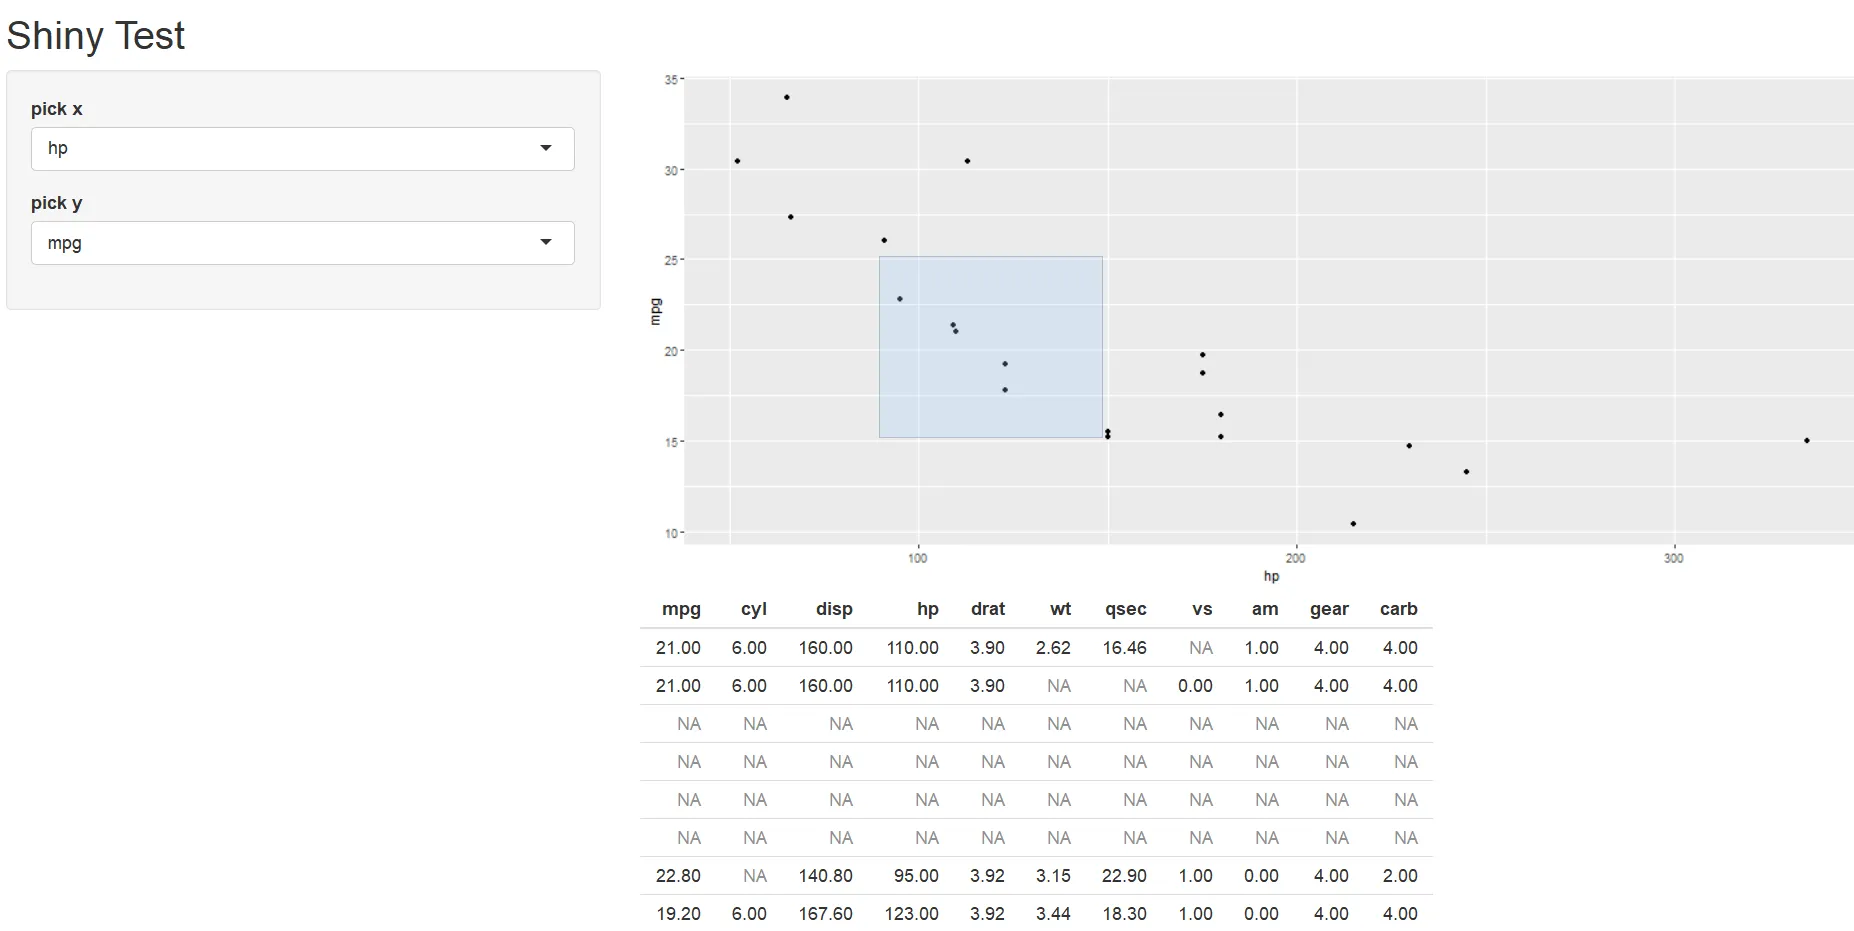
shiny的应用程序,用户可以选择绘图标准,并允许他们在绘图中进行刷选并在下方的表格中查看其选择。我的数据中有一些NA值。我注意到这些NAs最终会作为完整的NA行出现在我的刷选点表格中。我可以使用类似于此的方法手动删除它们。但是,我想知道是否在我的刷选操作中做错了什么导致了这种情况。

下面是带有可工作示例代码的图像,展示了我所说的刷选选择。

library(shiny)
library(tidyverse)

# replace some random values in mtcars with NA
set.seed(1)
mtnew <-
  as.data.frame(lapply(mtcars, function(m)
    m[sample(
      c(TRUE, NA),
      prob = c(0.8, 0.2),
      size = length(m),
      replace = TRUE
    )]))


# set up UI that allows user to pick x and y variables, see a plot, 
#  brush the plot, and see a table based on the brush
ui <- fluidPage(

  titlePanel("Shiny Test"),

  sidebarLayout(

    sidebarPanel(
      selectInput("xvar", 
                  "pick x", 
                  choices = names(mtnew)),
      selectInput("yvar", 
                  "pick y", 
                  choices = names(mtnew))),

    mainPanel(
      plotOutput("myplot", 
                 brush = brushOpts(id = "plot_brush")),
      tableOutput("mytable")
    )
  )
)


server <- function(input, output) {
  output$myplot <- renderPlot({
    ggplot(data = mtnew) + 
      geom_point(aes(x = !!rlang::sym(input$xvar), 
                     y = !!rlang::sym(input$yvar)))
  })

  output$mytable <- renderTable({
    brush_out <- brushedPoints(mtnew, input$plot_brush)
  })
}

# Complete app with UI and server components
shinyApp(ui, server)

enter image description here

1个回答

0

我猜你需要确定要表示的数据。

如果你只想要没有缺失值的定义记录,我建议使用complete.cases函数。不过这种解决方案会大大减少你的数据集(下面我已经在你的代码中应用了这个函数)。

另一个选择是保留所有记录,但是将缺失值替换为适当的值。在这种情况下,你可以考虑使用插补方法。可以参考这篇文章提供的示例。

library(shiny)
library(tidyverse)

# replace some random values in mtcars with NA
set.seed(1)
mtnew <-
  as.data.frame(lapply(mtcars, function(m)
    m[sample(
      c(TRUE, NA),
      prob = c(0.8, 0.2),
      size = length(m),
      replace = TRUE
    )]))

mtnew_complete <- mtnew[complete.cases(mtnew),] 

# set up UI that allows user to pick x and y variables, see a plot, 
#  brush the plot, and see a table based on the brush
ui <- fluidPage(

  titlePanel("Shiny Test"),

  sidebarLayout(

    sidebarPanel(
      selectInput("xvar", 
                  "pick x", 
                  choices = names(mtnew)),
      selectInput("yvar", 
                  "pick y", 
                  choices = names(mtnew))),

    mainPanel(
      plotOutput("myplot", 
                 brush = brushOpts(id = "plot_brush")),
      tableOutput("mytable")
    )
  )
)


server <- function(input, output) {
  output$myplot <- renderPlot({
    #ggplot(data = mtnew) + 
    ggplot(data = mtnew_complete) + 
      geom_point(aes(x = !!rlang::sym(input$xvar), 
                     y = !!rlang::sym(input$yvar)))
  })

  output$mytable <- renderTable({
    #brush_out <- brushedPoints(mtnew, input$plot_brush)
    brush_out <- brushedPoints(mtnew_complete, input$plot_brush)
  })
}

# Complete app with UI and server components
shinyApp(ui, server)

网页内容由stack overflow 提供, 点击上面的
可以查看英文原文,
原文链接