样例数据(修改自formattable的github文档):
df <- data.frame(
  id = 1:10,
  name = c("Bob", "Ashley", "James", "David", "Jenny",
           "Hans", "Leo", "John", "Emily", "Lee"),
  age = c(48, 47, 40, 28, 29, 29, 27, 27, 31, 30),
  test1_score = c(18.9, 19.5, 19.6, 12.9, 11.1, 7.3, 4.3, 3.9, 2.5, 1.6),
  test2_score = c(9.1, 9.1, 9.2, 11.1, 13.9, 14.5, 19.2, 19.3, 19.1, 18.8),
  stringsAsFactors = FALSE)
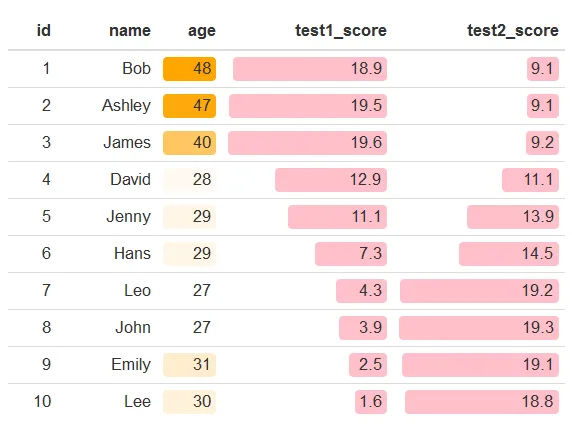
您可以像这样使用额外的颜色格式制作漂亮的表格:
library(formattable)
formattable(df, list(
  age = color_tile("white", "orange"),
  test1_score = color_bar("pink", 0.2),
  test2_score = color_bar("pink", 0.2)
))
看起来像这样:
我想要做的是对这个表进行过滤,只保留前 n 行 - 这里 n=3。不应该采用典型的子集方式来实现,因为颜色比例尺现在仅适用于数据子集的最小/最大值,而不是原始数据。即:
formattable(df[1:3,], list(
  age = color_tile("white", "orange"),
  test1_score = color_bar("pink", 0.2),
  test2_score = color_bar("pink", 0.2)
))
这看起来像这样:
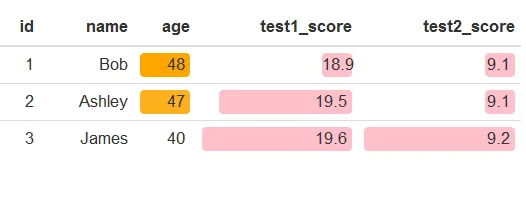
这明显重新调整了颜色。
查看对象的 str :
str(
formattable(df, list(
  age = color_tile("white", "orange"),
  test1_score = color_bar("pink", 0.2),
  test2_score = color_bar("pink", 0.2)
))
)

Classes ‘formattable’ and 'data.frame': 10 obs. of  5 variables:
 $ id         : int  1 2 3 4 5 6 7 8 9 10
 $ name       : chr  "Bob" "Ashley" "James" "David" ...
 $ age        : num  48 47 40 28 29 29 27 27 31 30
 $ test1_score: num  18.9 19.5 19.6 12.9 11.1 7.3 4.3 3.9 2.5 1.6
 $ test2_score: num  9.1 9.1 9.2 11.1 13.9 14.5 19.2 19.3 19.1 18.8
 - attr(*, "formattable")=List of 4
  ..$ formatter: chr "format_table"
  ..$ format   :List of 1
  .. ..$ :List of 3
  .. .. ..$ age        :function (x)
  .. .. ..$ test1_score:function (x)
  .. .. ..$ test2_score:function (x)
  ..$ preproc  : NULL
  ..$ postproc : NULL
无法仅过滤/子集生成的对象,因为该结构包含其他元素。
是否有办法仅输出前n行完整的颜色比例尺,就像使用整个表格/数据框一样?
formattable中的参数,因为当您将数据子集输入到formattable时,它显然无法了解其他行。 - Carl