我有一个带有共享x轴的双y轴图,我想让它们在y=0处对齐,这样我就可以画一条水平线来突出显示零刻度。目前这两个轴没有对齐,我不得不画两条线,这太糟糕了。我该如何实现这个目标?
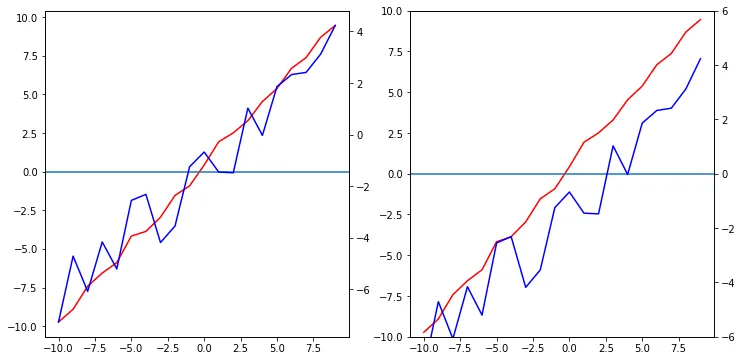
假设您使用共享轴创建了这些图表,只需修改 y 轴的范围以使其居中于零点或在两个图表中具有相似的偏移倍增器(即为两个图表设置 ax.set_ylim(-6,6))。以下代码为示例。
from matplotlib import pyplot as plt
import numpy as np

#Create some Fake Data
x =np.arange(-10,10)
y = x+np.random.rand(20)
y2 = 0.5*x-3.*np.random.rand(20)


#Figure
fig = plt.figure(figsize=(12,6))

#First subplot with zero line not even
ax1 = plt.subplot(121)
ax2 = ax1.twinx()

ax1.plot(x,y,c='r')
ax2.plot(x,y2,c='b')

ax1.axhline(0)

#Second Subplot with zero line the same on both axes
ax3 = plt.subplot(122)
ax4 = ax3.twinx()

ax3.plot(x,y,c='r')
ax4.plot(x,y2,c='b')

ax3.axhline(0)

#If you set your limits on both sides to have the same interval you will get the same zero line
ax3.set_ylim(-10,10)
ax4.set_ylim(-6,6)

plt.show()
我曾经遇到过同样的问题,我所做的就是根据最小和最大限制之间的比率来改变y轴的范围。如果你设置y轴的比率相同,那么零点应该也会相同。
fig, ax1 = plt.subplots()

ax1.plot(...)     # Plot first data set
ax2 = ax1.twinx()
ax2.plot(...)     # Plot second data set

ax1_ylims = ax1.axes.get_ylim()           # Find y-axis limits set by the plotter
ax1_yratio = ax1_ylims[0] / ax1_ylims[1]  # Calculate ratio of lowest limit to highest limit

ax2_ylims = ax2.axes.get_ylim()           # Find y-axis limits set by the plotter
ax2_yratio = ax2_ylims[0] / ax2_ylims[1]  # Calculate ratio of lowest limit to highest limit


# If the plot limits ratio of plot 1 is smaller than plot 2, the first data set has
# a wider range range than the second data set. Calculate a new low limit for the
# second data set to obtain a similar ratio to the first data set.
# Else, do it the other way around

if ax1_yratio < ax2_yratio:
    ax2.set_ylim(bottom = ax2_ylims[1]*ax1_yratio)
else:
    ax1.set_ylim(bottom = ax1_ylims[1]*ax2_yratio)

plt.tight_layout()
plt.show()
这是我的第一个回答,希望它足够并且没问题。
我发现了这个优秀的库,可以对齐轴并保持自动缩放:https://github.com/ryutok/mpl_axes_aligner
pip install mpl-axes-aligner
import numpy as np
import matplotlib.pyplot as plt
import mpl_axes_aligner

x = np.arange(0.0, 30, 0.1)
y1 = 0.1 * x * np.sin(x)
y2 = 0.001*x**3 - 0.03*x**2 + 0.12*x

fig = plt.figure()
ax1 = fig.add_subplot(111)
ax2 = ax1.twinx()

ax1.plot(x, y1, color='blue', label='Plot 1')
ax2.plot(x, y2, color='red', label='Plot 2')

# Align y = 0 of ax1 and ax2 with the center of figure.
mpl_axes_aligner.align.yaxes(ax1, 0, ax2, 0, 0.5)

plt.show()
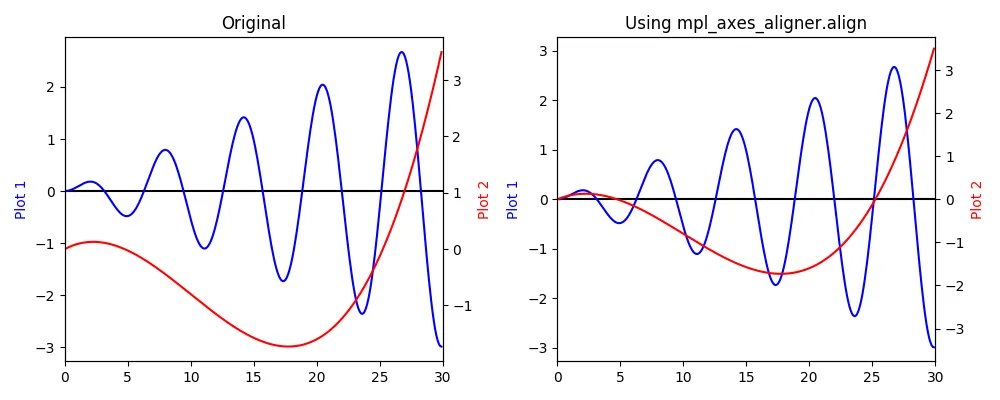
该软件包由ryotuk开发,上面的使用示例来自他软件包的文档。
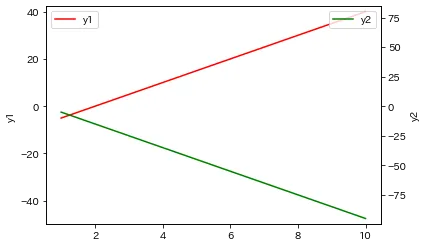
AttributeError: module 'mpl_axes_aligner' has no attribute 'align'。 - Dean这里有另一种方式,我认为更加灵活。
import numpy as np
%matplotlib inline
import matplotlib.pyplot as plt

def align_zeros(axes):

    ylims_current = {}   #  Current ylims
    ylims_mod     = {}   #  Modified ylims
    deltas        = {}   #  ymax - ymin for ylims_current
    ratios        = {}   #  ratio of the zero point within deltas

    for ax in axes:
        ylims_current[ax] = list(ax.get_ylim())
                        # Need to convert a tuple to a list to manipulate elements.
        deltas[ax]        = ylims_current[ax][1] - ylims_current[ax][0]
        ratios[ax]        = -ylims_current[ax][0]/deltas[ax]

    for ax in axes:      # Loop through all axes to ensure each ax fits in others.
        ylims_mod[ax]     = [np.nan,np.nan]   # Construct a blank list
        ylims_mod[ax][1]  = max(deltas[ax] * (1-np.array(list(ratios.values()))))
                        # Choose the max value among (delta for ax)*(1-ratios),
                        # and apply it to ymax for ax
        ylims_mod[ax][0]  = min(-deltas[ax] * np.array(list(ratios.values())))
                        # Do the same for ymin
        ax.set_ylim(tuple(ylims_mod[ax]))

x = np.array(range(1,11))
y1 = 5*x-10
y2 = -10*x+5

fig = plt.figure()
ax1 = fig.add_subplot(111)

ax1.plot(x,y1,'r',label='y1')
ax1.set_ylabel('y1')

ax2 = ax1.twinx()
ax2.plot(x,y2,'g',label='y2')
ax2.set_ylabel('y2')

align_zeros([ax1,ax2])

ax1.legend(loc='upper left')
ax2.legend(loc='upper right')

plt.show()