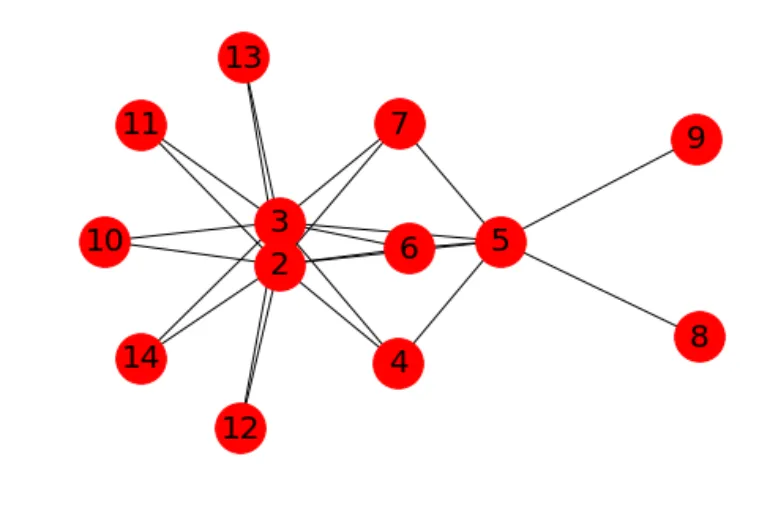
使用networkX和matplotlib在Python中绘制不同图表并放置在相同的位置/坐标上。

3

图表1:

邻接表:

2:[2,3,4,5,6,7,10,11,12,13,14]

3:[2,3,4,5,6,7,10,11,12,13,14]

5:[2,3,4,5,6,7,8,9]

图形:

`import networkx as nx 
 G = nx.Graph() 
 G1 = nx.Graph() 
 import matplotlib.pyplot as plt 
 for i, j in adj_list.items():
     for k in j:
           G.add_edge(i, k)  
pos = nx.spring_layout(G) 
nx.draw(G, with_labels=True, node_size = 1000, font_size=20)
plt.draw() 
plt.figure() # To plot the next graph in a new figure
plt.show() `

图1

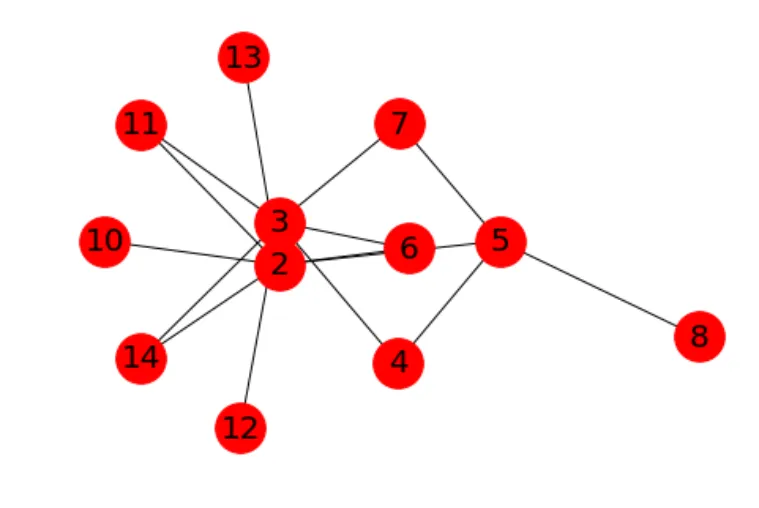
在图2中,我删除了一些边并重新绘制了图形,但节点的位置正在改变,如何存储节点的位置以供下一个图形使用?

1个回答

2

当绘制图形时,您需要重复使用pos变量。 nx.spring_layout返回一个字典,其中节点ID是键,值是要绘制的节点的x、y坐标。只需重复使用相同的pos变量,并将其作为属性传递给nx.draw函数,格式如下:

import networkx as nx 
import matplotlib.pyplot as plt
G = nx.Graph() 
G1 = nx.Graph()
adj_list = {2: [2, 3, 4, 5, 6, 7, 10, 11, 12, 13, 14],    
3: [2, 3, 4, 5, 6, 7, 10, 11, 12, 13, 14],    
5: [2, 3, 4, 5, 6, 7, 8, 9]}
import matplotlib.pyplot as plt 
for i, j in adj_list.items():
    for k in j:
        G.add_edge(i, k)  
pos = nx.spring_layout(G)   #<<<<<<<<<< Initialize this only once
nx.draw(G,pos=pos, with_labels=True, node_size = 1000, font_size=20)  #<<<<<<<<< pass the pos variable
plt.draw() 
plt.figure() # To plot the next graph in a new figure
plt.show()

enter image description here

现在我将创建一个新的图,并只添加一半的边

cnt = 0
G = nx.Graph()
for i, j in adj_list.items():
    for k in j:
        cnt+=1
        if cnt%2 == 0:
            continue
        G.add_edge(i, k)  

nx.draw(G,pos=pos, with_labels=True, node_size = 1000, font_size=20)  #<-- same pos variable is used
plt.draw() 
plt.figure() # To plot the next graph in a new figure
plt.show()

enter image description here 如您所见,只添加了一半的边缘,节点位置仍然保持不变。


谢谢你,Mohammed Kashif :) - Abhishek Dhanasetty

网页内容由stack overflow 提供, 点击上面的
可以查看英文原文,
原文链接