我正在使用R制作栅格数据绘图。当我调整到要处理的区域时,R显示不想被裁剪的ylim。
我尝试过:
# set lon lat
ylim=c(-4,2)
xlim=c(118,126)

plot(pm10_mean,xlim=xlim, ylim=ylim)
plot(shp, add=TRUE)
plot(shp2, add=TRUE)
但我得到的图片如下所示
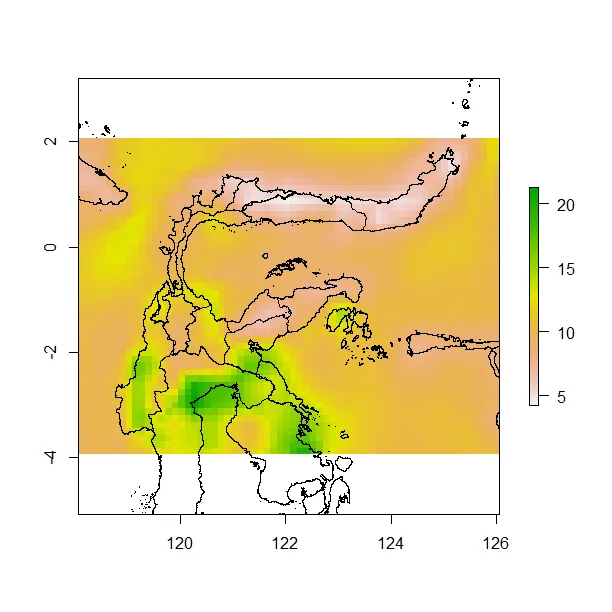
如何删除2上方和-4下方的空白? 我只想绘制xlim和ylim中的区域
我认为spplot的功能很好,但是它运行非常缓慢,并且难以自定义。
我在gis.stackexchange中找到了一个更近期的重复问题,并提供以下答案:
我发现raster::plot的文档说明可以指定绘图窗口,但在我的经验中,它没有任何效果。相反,它将始终假定您给出的栅格范围。
我的建议解决方法是首先使用空对象绘制所需的绘图窗口,然后将栅格绘图添加到此窗口。
my_window <- extent(-4, 2, 118, 126)
plot(my_window, col=NA)
plot(my_raster, add=T)
对我来说,这达到了我想要的效果。但是如果你正在绘制一个堆栈或砖块,我的经验是add功能无法正常工作。解决方法是使用subset,例如:plot(subset(my_brick,4), add=T)
我以前遇到过这个问题。您可以手动调整绘图区域以删除空白区域,或插入多边形来覆盖不需要的形状文件区域。但最安全的选项是使用spplot,因为它会自动调整绘图区域:
require(maptoolS)
require(raster)
data(wrld_simpl)
rs=raster()
rs[]=1
id_shp=wrld_simpl[which(wrld_simpl$ISO2=="ID"),]
rs=crop(rs,id_shp)
rs=disaggregate(rs,40)
rs=mask(rs,id_shp)
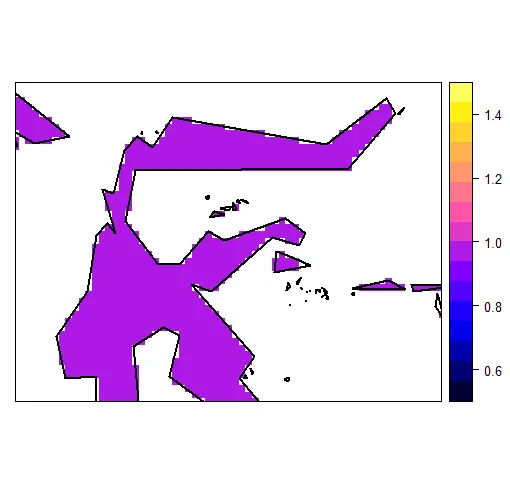
spplot(rs,ylim=c(-4,2),xlim=c(118,126),sp.layout=list('sp.lines', id_shp, lwd=2,first=F))
只需简单地绘制一个空图并添加您的光栅图像,就可以轻松完成。
plot(NULL, xlim = c(-114.5, -35.5), ylim = c(-24.5, 29.5), asp = 30/30,
     xlab = "Longitude", ylab = "Latitude")
plot(your_raster, add = T)
堆叠似乎仍然有效
yaxs="i"和xaxs="i"。就像这样plot(pm10_mean,xlim=xlim, ylim=ylim, xaxs = "i", yaxs = "i")。 - deepseefan