仅使用下限设置R绘图的xlim

10

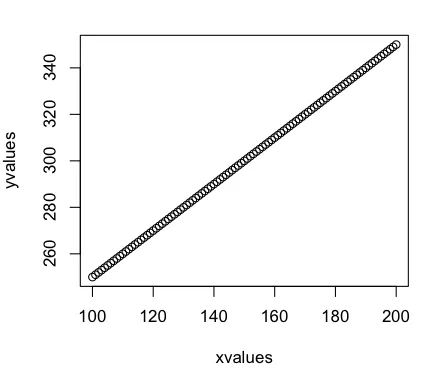
假设我创建了一个像这样的简单图:

xvalues <- 100:200
yvalues <- 250:350
plot(xvalues, yvalues)
在此输入图片描述

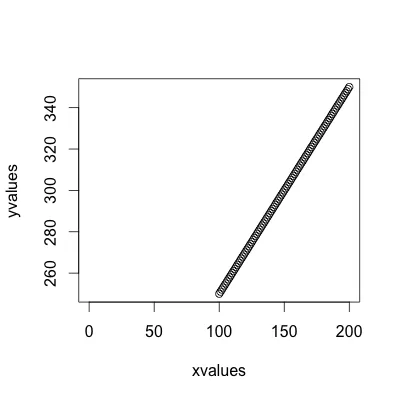
然而,我想让x轴从0开始,并且将上限留给R来计算。我该怎么做呢?

我知道有一个选项xlim=c(lower bound, upper bound),但是我不知道上限是多少。而且,显然我无法让上限未指定:

> plot(xvalues, yvalues, xlim=c(0))
Error in plot.window(...) : invalid 'xlim' value

如果我不需要计算xvalues向量的最大值来获取上限,那将是非常浪费的,特别是对于一个非常大的数据向量。
2个回答

7
你可以采用以下两种方法之一:
计算极限 注:此处的“极限”指的是系统资源限制。
xlim <- c(0, max(xvalues))

xlim现在可以作为plotxlim参数提供。

xvalues <- 100:200
yvalues <- 250:350
plot(xvalues, yvalues, xlim=xlim)

enter image description here

par返回限制条件

这个有点复杂,但有时很有用(对于您的情况来说可能有些过度了,但为了完整性)。您可以将数据绘制一次,使用par("usr")获取用户坐标下的绘图区域的限制条件。现在,您可以在新的绘图中使用这些限制条件。

plot(xvalues, yvalues, xaxs="i")
xmax <- par("usr")[2]
plot(xvalues, yvalues, xlim=c(0,xmax))

PS. 我使用了 xaxs="i" ,因此结果会在两端没有小扩展。


谢谢。关于使用max()来设置xlim,我宁愿不运行max(),因为在一个非常大的数据集上调用它似乎是浪费的。 - stackoverflowuser2010
1
嗯,我想不出避免这个问题的方法。但是 max 函数非常快。对于一个具有1亿个条目的向量,它只需要不到200毫秒的时间,试试 x <- rnorm(1e8); system.time(max(x))。因此,如果这仍然是个问题,那么你的数据一定非常巨大。 - Mark Heckmann
谢谢。只是看起来像是浪费 CPU 循环。 :P - stackoverflowuser2010

1

您可以使用您的值中的最大值来简单地设置x的最大值:

xvalues <- 1:99
yvalues <- rep(1,99)


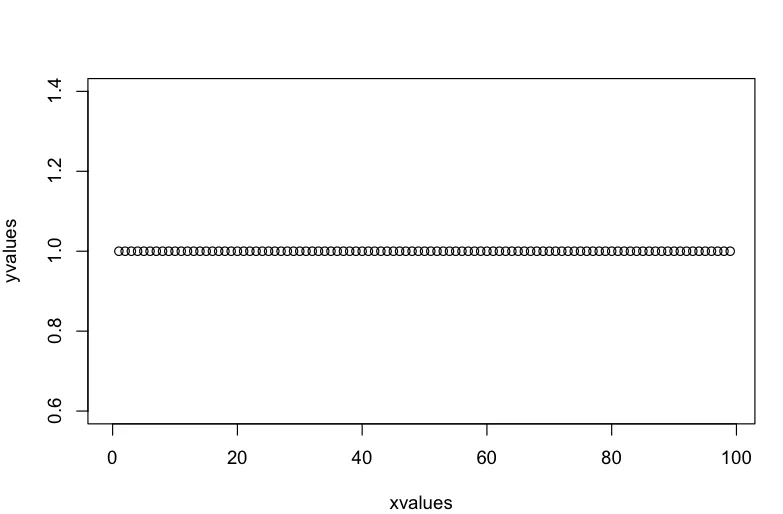
plot(xvalues, yvalues, xlim = c(0, max(xvalues)) )

enter image description here


网页内容由stack overflow 提供, 点击上面的
可以查看英文原文,
原文链接