是否可能仅设置连续比例的下限而不设定上限? 我想使所有的图表都以0为基准,而无需指定上限。
例如:
+ scale_y_continuous(minlim=0)
expand_limits。ggplot(mtcars, aes(wt, mpg)) + geom_point() + expand_limits(y=0)
下面是两种图形的比较:
expand_limits) + geom_point()")
expand_limits) + geom_point() + expand_limits(y=0)")
从ggplot2版本1.0.0开始,您可以只指定一个限制,并使另一个限制像通常设置的那样成为NA。这种方法将允许轴范围的扩展和截断。
ggplot(mtcars, aes(wt, mpg)) + geom_point() +
  scale_y_continuous(limits = c(0, NA))
) + geom_point() + scale_y_continuous(limits = c(0, NA))指定y轴限制,通过<code>ylim(c(0, NA))</code>也可以得到相同的图形。")
可以尝试使用aes(ymin=0),就像这样:
ggplot(mtcars, aes(wt, mpg)) + geom_point() + aes(ymin=0)
aes(ymin=o) 不会设置垂直轴的最小值。这并不是对问题的回答。 - randyscale_y_continuous(limits = c(0, NA), expand = c(0,0))
coord_cartesian() 来实现这个功能? - randy如果您想保持 ggplot 默认计算的比例尺的上限“不变”,并且消除下限的填充,使绘图区域从精确的0开始,那么在ggplot2 v3.0.0+中,您可以为比例尺的上限和下限指定单独的扩展值。
scale_y_continuous(limits = c(0, NA), expand = expansion(mult=c(0, 0.05)))
请参阅 help 中对于 scale_continuous() 的限制和扩展参数的描述。
使用方便的函数 expansion() 生成扩展参数的值。连续变量的默认值是在每个侧面扩展5%,离散变量的默认值是在每个侧面扩展0.6个单位。
我们使用 mult 参数来计算5%的扩展。
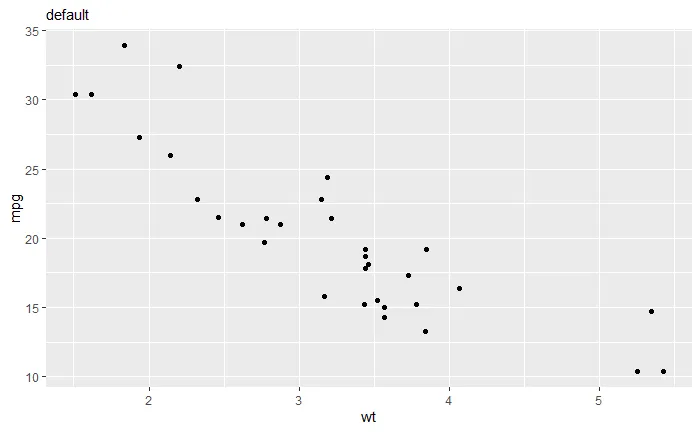
ggplot(mtcars, aes(wt, mpg)) + geom_point() +
  labs(subtitle="default")
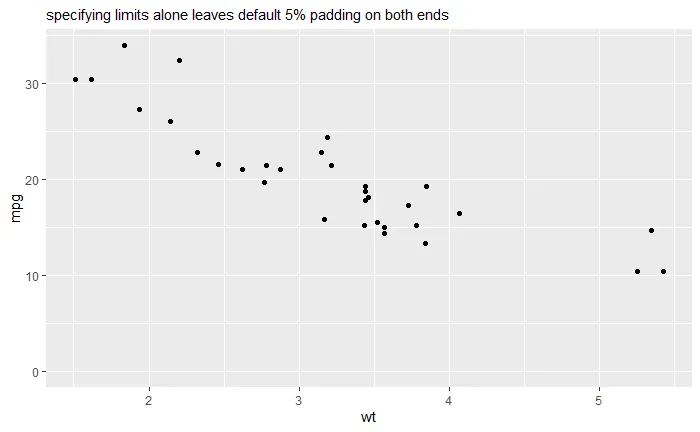
ggplot(mtcars, aes(wt, mpg)) + geom_point() +
  scale_y_continuous(limits=c(0, NA))+
  labs(subtitle="specifying limits alone leaves default 5% padding on both ends")
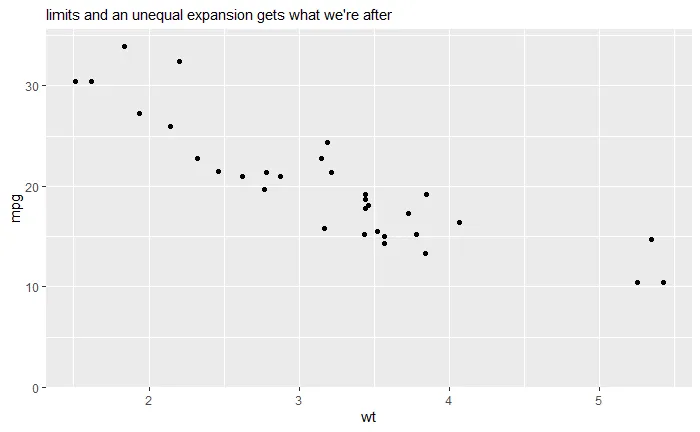
ggplot(mtcars, aes(wt, mpg)) + geom_point() +
  scale_y_continuous(limits=c(0, NA), expand=expansion(mult=c(0, 0.05))) +
  labs(subtitle = "limits and an unequal expansion gets what we're after")
我认为你不能直接这样做。但是,作为一种解决方法,你可以模仿ggplot2确定上限的方式:
scale_y_continuous(limits=c(0, max(mydata$y) * 1.1))