Python中带有x和y坐标不确定度的线性拟合

11

嗨,我想请教我的Python同行们如何执行线性拟合。

过去两周,我一直在搜索执行此任务的方法/库,并愿意分享我的经验:

如果您想基于最小二乘法执行线性拟合,则有许多选择。例如,在numpy和scipy中都可以找到类。我选择了linfit提供的一个选项(它遵循IDL中linfit函数的设计):

http://nbviewer.ipython.org/github/djpine/linfit/blob/master/linfit.ipynb

该方法假定您在y轴坐标中引入sigmas以适应数据。

然而,如果您已经量化了x轴和y轴的不确定性,则选项并不多(主要的Python科学库中没有IDL "Fitexy"等效项)。到目前为止,我只发现“kmpfit”库执行此任务。幸运的是,它有一个非常完整的网站描述了所有功能:

https://github.com/josephmeiring/kmpfit http://www.astro.rug.nl/software/kapteyn/kmpfittutorial.html#

如果有人知道其他方法,我也很想了解。

无论如何,希望这些对您有所帮助。

2个回答

24

Scipy中的正交距离回归可以使用xy的误差进行非线性拟合。

下面显示了一个基于scipy页面中给出的示例的简单示例。它试图将二次函数拟合到一些随机数据。

import numpy as np
import matplotlib.pyplot as plt
from scipy.odr import *

import random

# Initiate some data, giving some randomness using random.random().
x = np.array([0, 1, 2, 3, 4, 5])
y = np.array([i**2 + random.random() for i in x])

x_err = np.array([random.random() for i in x])
y_err = np.array([random.random() for i in x])

# Define a function (quadratic in our case) to fit the data with.
def quad_func(p, x):
     m, c = p
     return m*x**2 + c

# Create a model for fitting.
quad_model = Model(quad_func)

# Create a RealData object using our initiated data from above.
data = RealData(x, y, sx=x_err, sy=y_err)

# Set up ODR with the model and data.
odr = ODR(data, quad_model, beta0=[0., 1.])

# Run the regression.
out = odr.run()

# Use the in-built pprint method to give us results.
out.pprint()
'''Beta: [ 1.01781493  0.48498006]
Beta Std Error: [ 0.00390799  0.03660941]
Beta Covariance: [[ 0.00241322 -0.01420883]
 [-0.01420883  0.21177597]]
Residual Variance: 0.00632861634898189
Inverse Condition #: 0.4195196193536024
Reason(s) for Halting:
  Sum of squares convergence'''

x_fit = np.linspace(x[0], x[-1], 1000)
y_fit = quad_func(out.beta, x_fit)

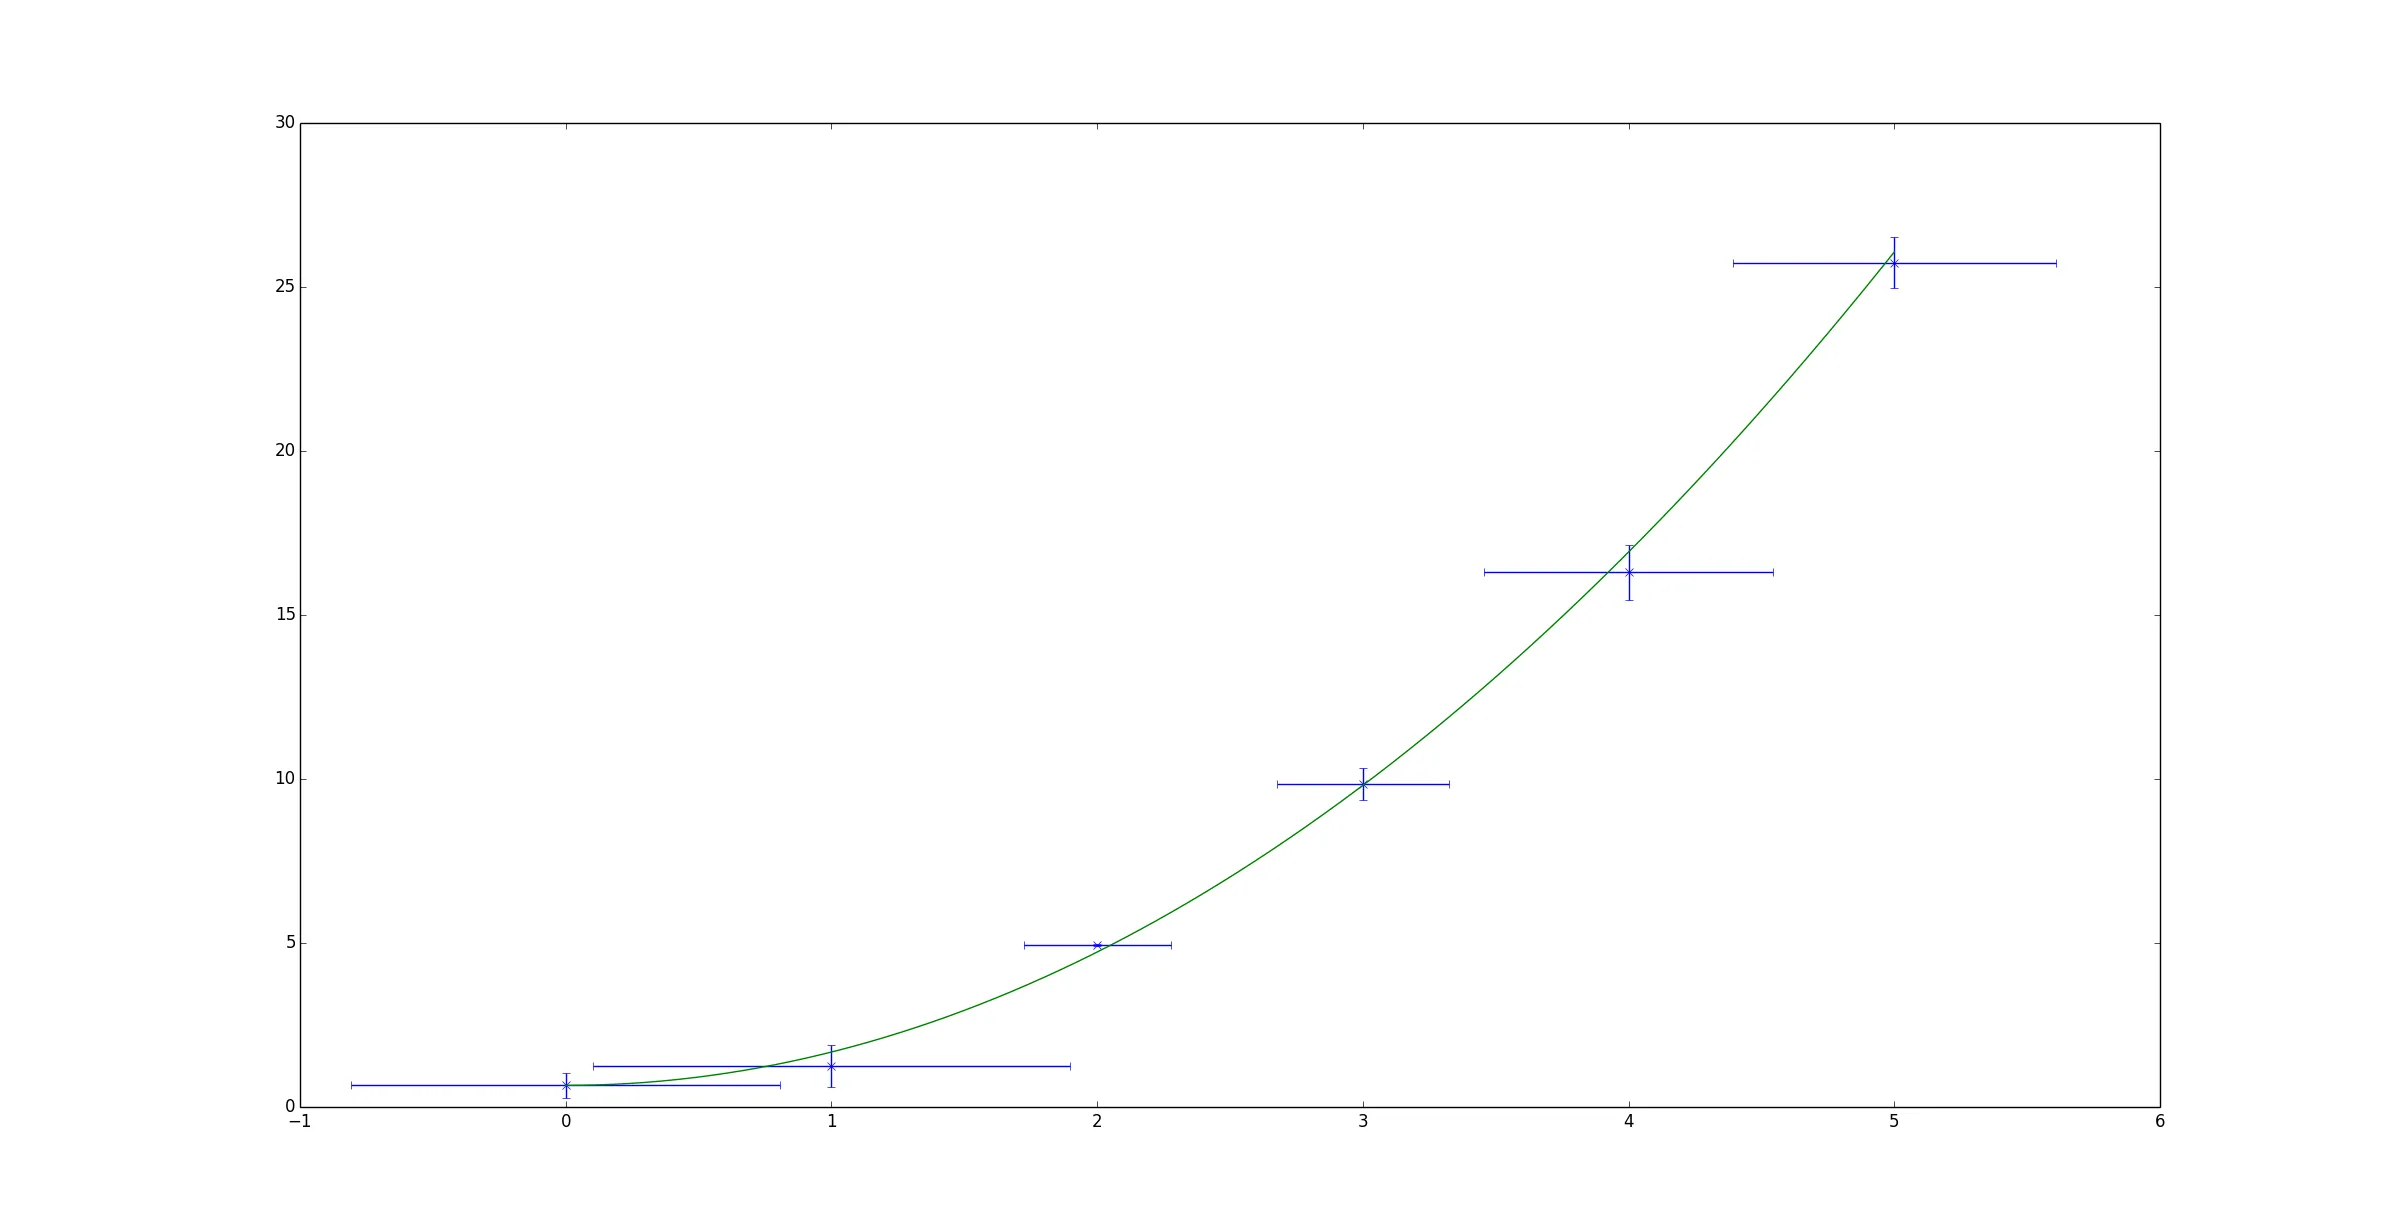
plt.errorbar(x, y, xerr=x_err, yerr=y_err, linestyle='None', marker='x')
plt.plot(x_fit, y_fit)

plt.show()

显示数据和拟合结果的示例输出。


2
谢谢,这非常有用,我不知道这个ODR方法。 - Delosari
这个问题在于它只支持相对sigma,就像我目前测试过的一样。因此,拟合得到的误差并不能真正覆盖所有内容。 - Martin Ueding

7
您可以使用与最大特征值相关联的协方差矩阵的特征向量来进行线性拟合。
import numpy as np
import matplotlib.pyplot as plt

x = np.arange(6, dtype=float)
y = 3*x + 2
x += np.random.randn(6)/10
y += np.random.randn(6)/10

xm = x.mean()
ym = y.mean()

C = np.cov([x-xm,y-ym])
evals,evecs = np.linalg.eig(C)

a = evecs[1,evals.argmax()]/evecs[0,evals.argmax()]
b = ym-a*xm

xx=np.linspace(0,5,100)
yy=a*xx+b

plt.plot(x,y,'ro',xx,yy)
plt.show()

enter image description here


谢谢,这非常有趣。 - Delosari

网页内容由stack overflow 提供, 点击上面的
可以查看英文原文,
原文链接