我遇到了一个奇怪的错误,但似乎无法理解:
- 我在二维空间中绘制了一个随机变量Z(X,Y)的N个值(X,Y)。
- 我构建了直方图并使用imshow绘图。
- 我用(X,Y)值计算线性回归并绘制出来:
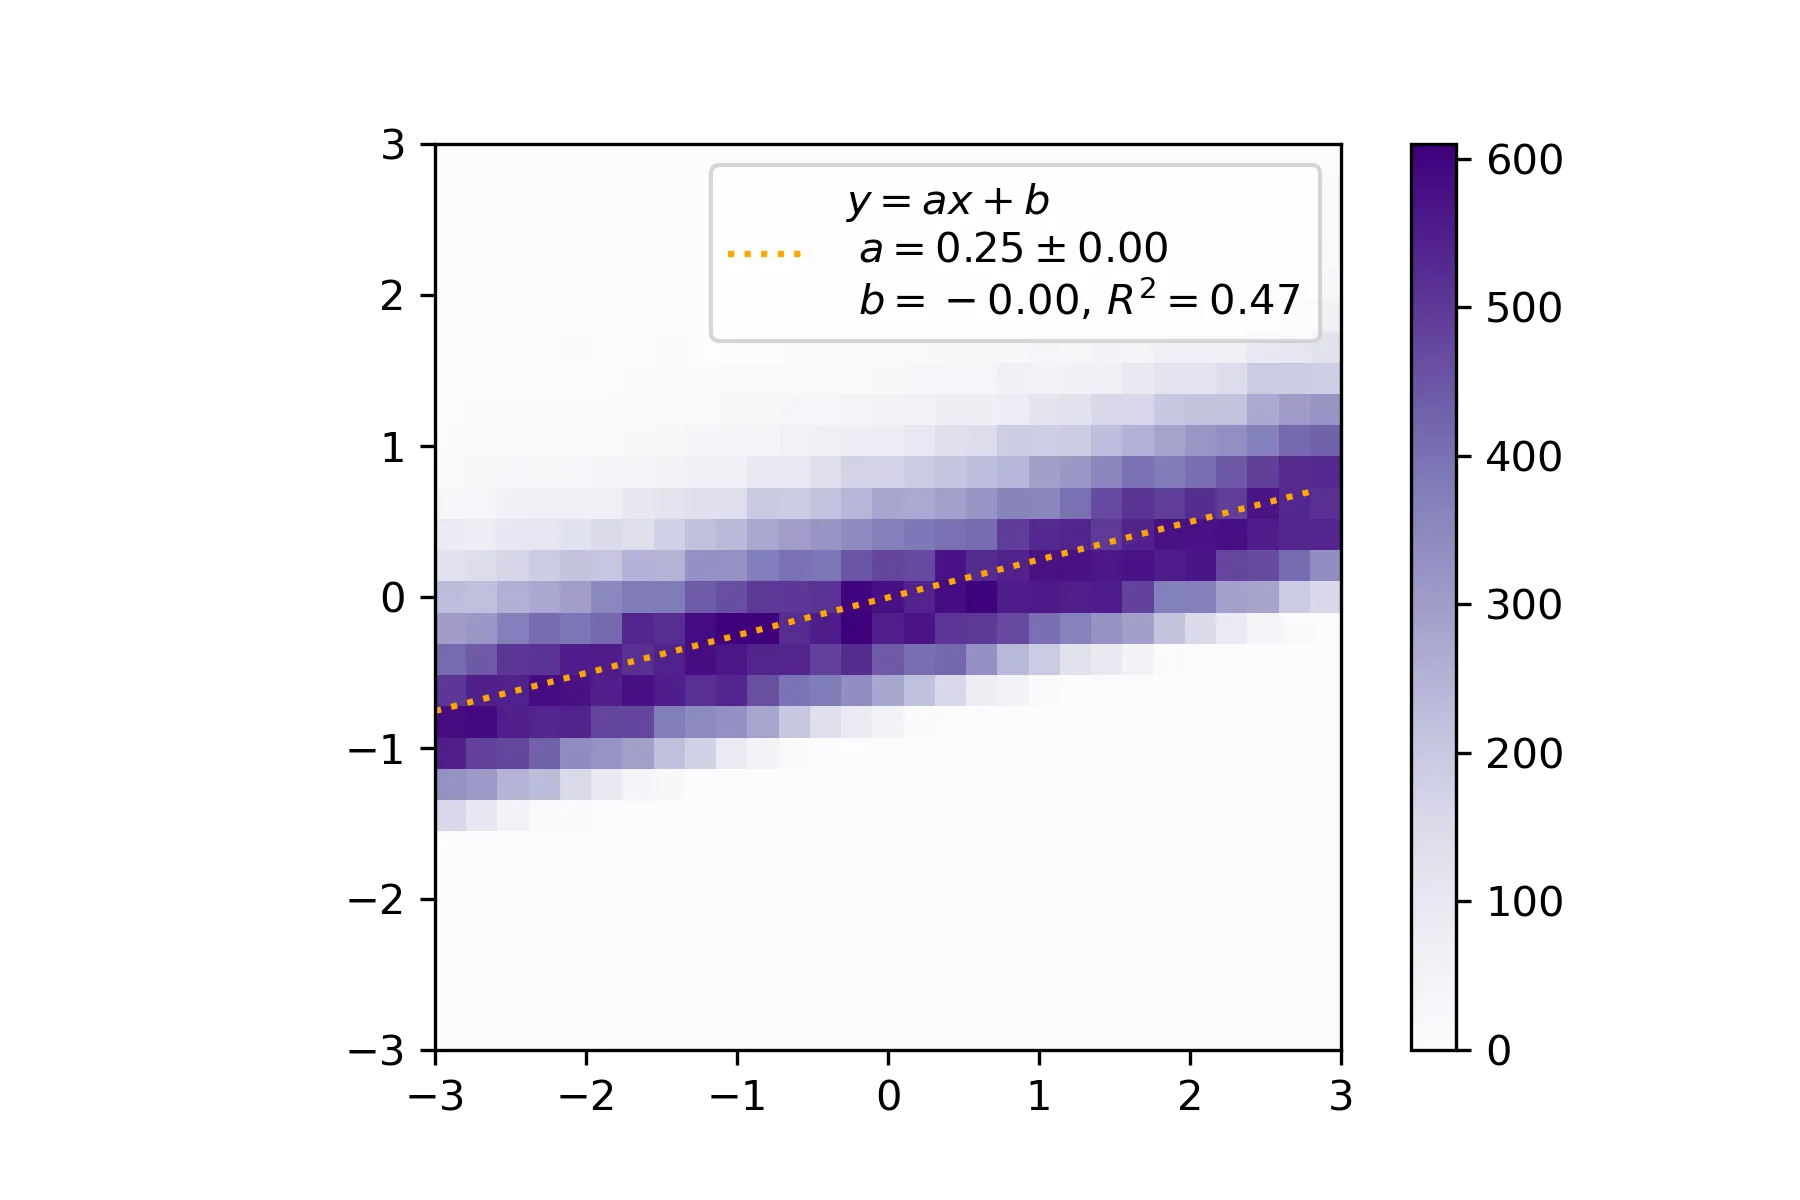 到目前为止,一切看起来都很正常。
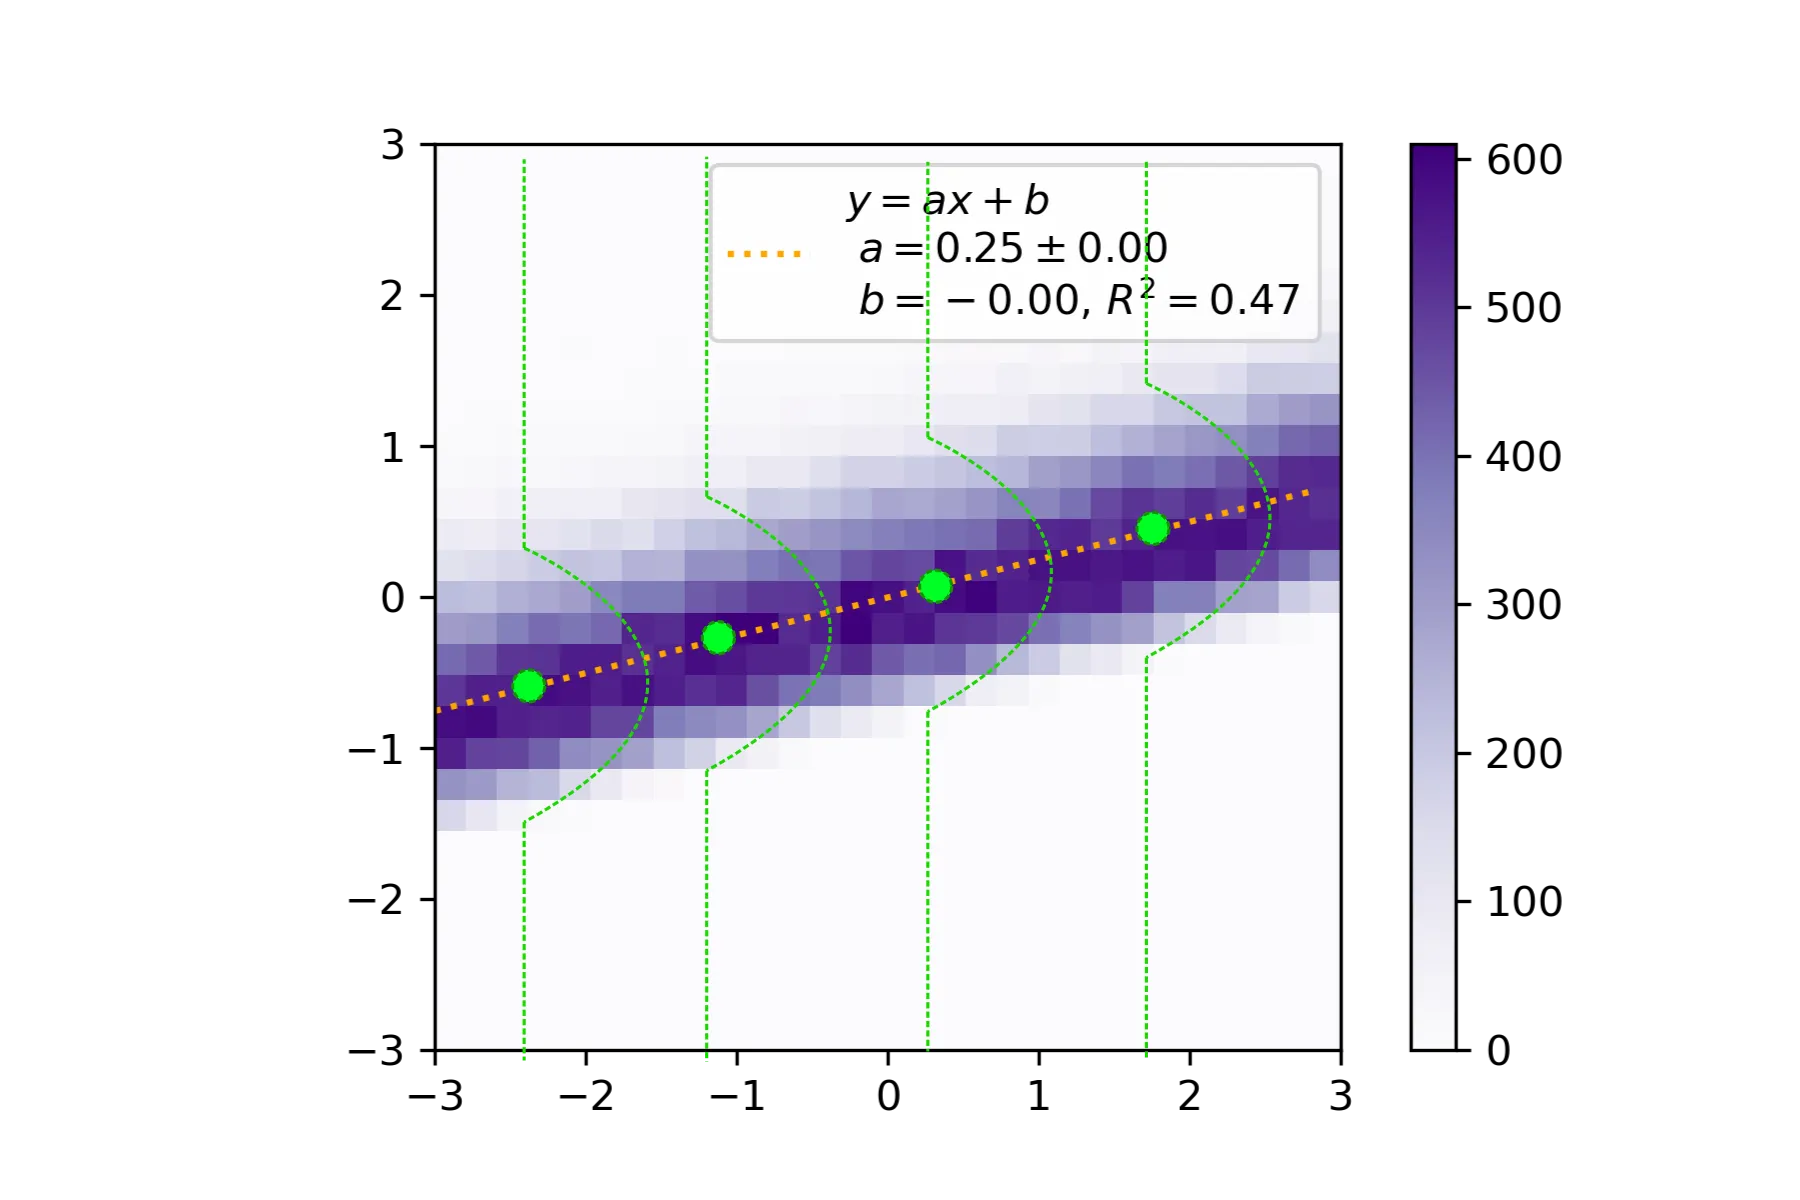
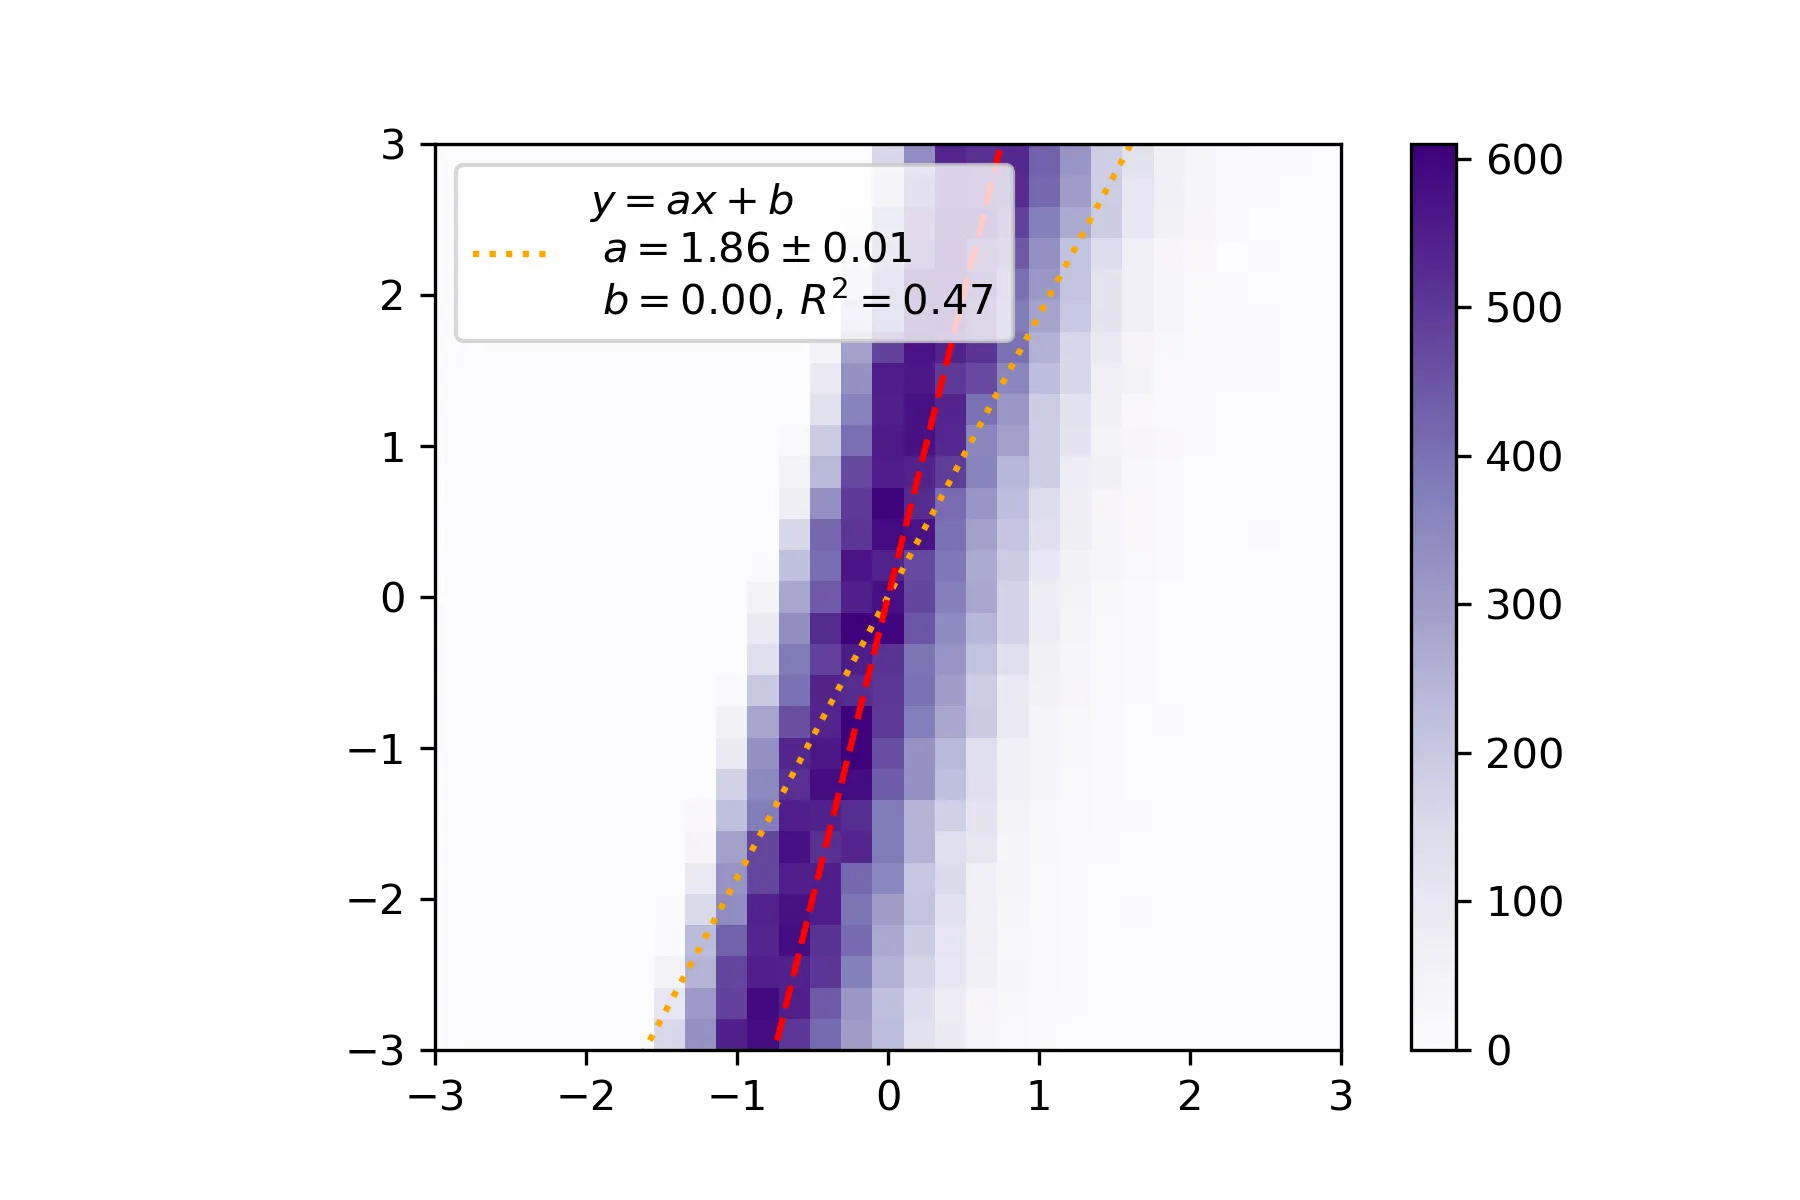
 - 现在我重复步骤1、2和3,但交换X和Y。我期望找到相同的图片,但坐标轴交换了。然而,这次线性回归(橙色虚线)不正确,斜率与预期的1/0.25(红色虚线)不同。
有什么想法错在哪里吗?
Python代码:
from scipy.stats import linregress
import numpy as np
import matplotlib.pyplot as plt

#Parameters
delta = 0.2
N = 10**5

#Bins
x = y = np.arange(-3.0, 3.0, delta)

#Draw N values of the random variable Z(X,Y)
rnd = np.random.default_rng(seed = 0)
Z = rnd.uniform(0, 1, N)
X = rnd.uniform(-3, 3, N)
Y = 0.25*X + np.sqrt(np.log( 1 / Z ) ) - 0.89

#Construct histogram
H, xedges, yedges = np.histogram2d(X, Y, bins=[x, y])
#Tranpose to have x in columns and y in rows
H = H.T

#Plot
plt.imshow(H, cmap='Purples',
            origin='lower', extent=[-3, 3, -3, 3])

#Do linear regresion
lr = linregress(X, Y)
poly1d_fn = np.poly1d([lr.slope, lr.intercept])
xLine=[xedges[0], xedges[-1]]
plt.plot(xLine, poly1d_fn(xLine), 'orange', ls = ':',
            label = '$y = ax+b$\n $a = %.2f \pm %.2f$\n $b = %.2f$, $R^2 = %.2f$ '%(lr.slope, lr.stderr, lr.intercept, lr.rvalue**2))

plt.colorbar()
plt.legend()
plt.savefig("first.png", dpi = 300)

#Repeat but switching X with Y
plt.figure()
X2 = Y
Y2 = X
H, xedges, yedges = np.histogram2d(X2, Y2, bins=[x, y])
H = H.T

plt.imshow(H, cmap='Purples',
            origin='lower', extent=[-3, 3, -3, 3])

lr = linregress(X2, Y2)
poly1d_fn = np.poly1d([lr.slope, lr.intercept])
xLine=[xedges[0], xedges[-1]]
plt.plot(xLine, poly1d_fn(xLine), 'orange', ls = ':',
            label = '$y = ax+b$\n $a = %.2f \pm %.2f$\n $b = %.2f$, $R^2 = %.2f$ '%(lr.slope, lr.stderr, lr.intercept, lr.rvalue**2))

plt.plot(xLine, [4*z for z in xLine], 'red', ls = '--')


plt.ylim([-3, 3])
plt.colorbar()
plt.legend()
plt.savefig("second.png", dpi = 300)