如何使用加权邻接矩阵绘制边权重?

3
我有一个加权邻接矩阵 C,代表一个有向图。当没有从 j 到 i 的边时,C(j,i)=0;如果 C(j,i)>0,则 C(j,i) 为边的权重。
现在我想绘制这个有向图。有很多解决方案可以手动添加边,例如在此处查看: Add edge-weights to plot output in networkx 但我想基于我的矩阵 C 绘制边和边的权重;我从以下方式开始:
def DrawGraph(C):

    import networkx as nx
    import matplotlib.pyplot as plt 


    G = nx.DiGraph(C)

    plt.figure(figsize=(8,8))
    nx.draw(G, with_labels=True)

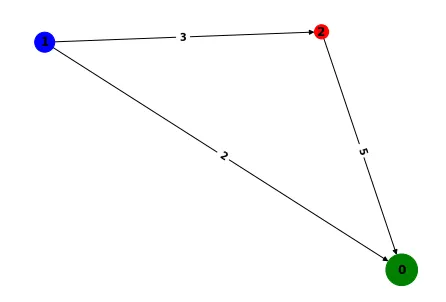
这会绘制一个图形,顶点上有标签,但没有边权 - 我也无法从上面的链接中调整技术使其正常工作 - 那我该怎么办呢?
那我如何改变节点大小和颜色?
1个回答

4

使用networkx可以通过多种方式实现此目标 - 这是一种解决方案,应该符合您的要求:

代码:

# Set up weighted adjacency matrix
A = np.array([[0, 0, 0],
              [2, 0, 3],
              [5, 0, 0]])

# Create DiGraph from A
G = nx.from_numpy_matrix(A, create_using=nx.DiGraph)

# Use spring_layout to handle positioning of graph
layout = nx.spring_layout(G)

# Use a list for node_sizes
sizes = [1000,400,200]

# Use a list for node colours
color_map = ['g', 'b', 'r']

# Draw the graph using the layout - with_labels=True if you want node labels.
nx.draw(G, layout, with_labels=True, node_size=sizes, node_color=color_map)

# Get weights of each edge and assign to labels
labels = nx.get_edge_attributes(G, "weight")

# Draw edge labels using layout and list of labels
nx.draw_networkx_edge_labels(G, pos=layout, edge_labels=labels)

# Show plot
plt.show()

结果:

enter image description here

该图片为结果展示。

当我使用命令“G = nx.from_numpy_matrix(A, create_using=nx.DiGraph)”时,使用完全相同的A,我会收到错误消息:“输入图不是networkx图类型” - 也许缺少某种包? - Ivan

网页内容由stack overflow 提供, 点击上面的
可以查看英文原文,
原文链接