如何使用 pandas 创建堆叠子图

4

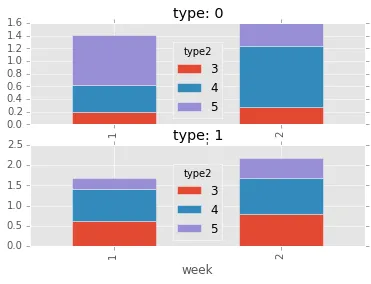
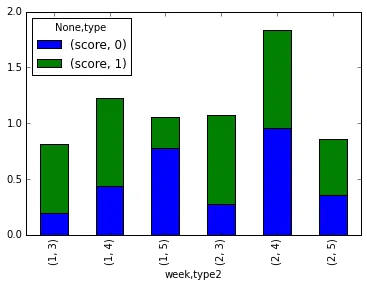
我想为我的数据创建堆叠子图。我希望以“类型”和“星期”作为我的X轴,以“分数”为堆叠的子图。

np.random.seed(1234)
test = pd.DataFrame({'week':[1,1,1,1,1,1,2,2,2,2,2,2],
                     'score':np.random.uniform(0,1,12),
                    'type': [0,1,0,1,0,1,0,1,0,1,0,1],
                     'type2':[3,3,4,4,5,5,3,3,4,4,5,5]})

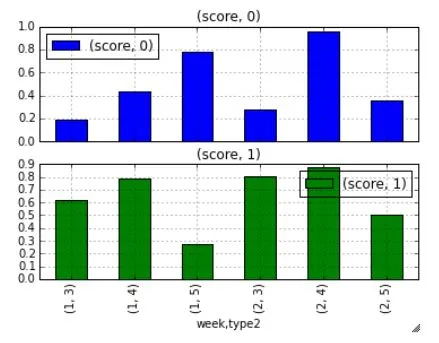
这是我现在拥有的内容,如果我添加一个名为“subplot = True”的参数。
test.groupby(['week','type','type2']).agg('sum').unstack(1).plot(kind='bar', subplots=True)

enter image description here


你好,能否添加对plot调用所对应的代码。这将有助于准确理解你想做什么。 - Romain
@RomainX 我添加了一个图表,希望它有所帮助。 - collarblind
谢谢,我已经发布了一个答案,请告诉我它是否符合您的期望。 - Romain
2个回答

4

我认为 - 但不确定 - 结合 stackedsubplots 选项比较困难。所以这里提供一种解决方案,可以产生期望的输出,但可能需要改进。

# Test data
np.random.seed(1234)
test = pd.DataFrame({'week':[1,1,1,1,1,1,2,2,2,2,2,2],
                     'score':np.random.uniform(0,1,12),
                    'type': [0,1,0,1,0,1,0,1,0,1,0,1],
                     'type2':[3,3,4,4,5,5,3,3,4,4,5,5]})
grouped = test.groupby(['type','week','type2']).agg('sum')

# Preparing plots
fig, axes = plt.subplots(nrows=2)

for group_name, group in grouped.groupby(level=0):
    group.index = group.index.droplevel(0)
    group = group.unstack(1)
    group.columns = group.columns.droplevel()
    group.plot(kind='bar', stacked=True, ax=axes[group_name], title='type: ' + str(group_name))

result


2
如果我理解正确,您可以添加 stacked=True 参数吗?
test.groupby(['week','type','type2']).agg('sum').unstack(1).plot(kind='bar', stacked=True)

enter image description here


现在已经接近了,我想在'type2'上加入一个次图。这样就会有两个图,每个图都有一个堆积条形图。 - collarblind
我不理解。你的意思是type2=3、4、5有3个子图吗? - matt_s

网页内容由stack overflow 提供, 点击上面的
可以查看英文原文,
原文链接