我写了这段代码来读取Excel文件中的数据并绘制它们。对于特定的x值,我希望知道所有线的y值,因此我创建了一个滑块来更改这个x值,但我无法刷新打印y值的文本。
代码如下:
代码如下:
import numpy as np
from openpyxl import load_workbook as ld
import matplotlib
matplotlib.use('TkAgg')
import matplotlib.pyplot as plt
from matplotlib.widgets import Slider

wb = ld(filename='example.xlsx')
data = wb['data']
time = wb['time']
row = data.max_row
column = data.max_column
x = np.ones((row, column))
y = np.ones((row, column))
result = np.ones(row)
for i in range(0, row):
    for j in range(0, column):

        x[i][j] = time.cell(row=i+1, column=j+1).value
        y[i][j] = data.cell(row=i+1, column=j+1).value


fig, ax = plt.subplots()
plt.subplots_adjust(left=0.25, bottom=0.25)
plt.plot(x[0], y[0], label='line1')
plt.plot(x[1], y[1], label='line2')
plt.plot(x[2], y[2], label='line3')
line, = plt.plot((np.amin(x), np.amin(x)), (np.amin(y), np.amax(y)))
plt.legend()
plt.grid(True)


axtime = plt.axes([0.25, 0.1, 0.65, 0.03])
stime = Slider(axtime, 'time', np.amin(x), np.amax(x), valinit=np.amin(x))


def y_text(r):
    ax.text(10, 8, str(r), style='italic')


def find(t):
    global x, y, result

    for i in range(0, row):
        for j in range(0, column):

            if x[i][j] == t or (t < x[i][j] and j == 0) or (t > x[i][j] and j == column):
                result[i] = y[i][j]
            elif x[i][j] < t < x[i][j+1]:
                result[i] = ((t-x[i][j])/(x[i][j+1]-x[i][j]))*(y[i][j+1]-y[i][j])+y[i][j]
    return result


def update(val):
    line.set_xdata(stime.val)
    find(stime.val)
    y_text(stime.val)
    fig.canvas.draw()
stime.on_changed(update)


plt.show()
结果如下所示:
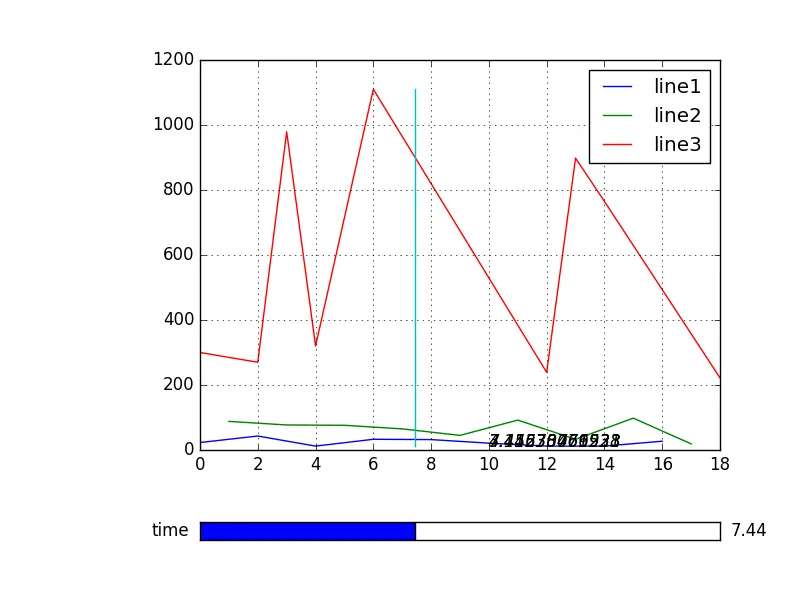
正如您所看到的,文本被覆盖了。