这里提供了一种解决方案,只需使用
networkx创建多层图,并通过自己的方法计算节点位置。
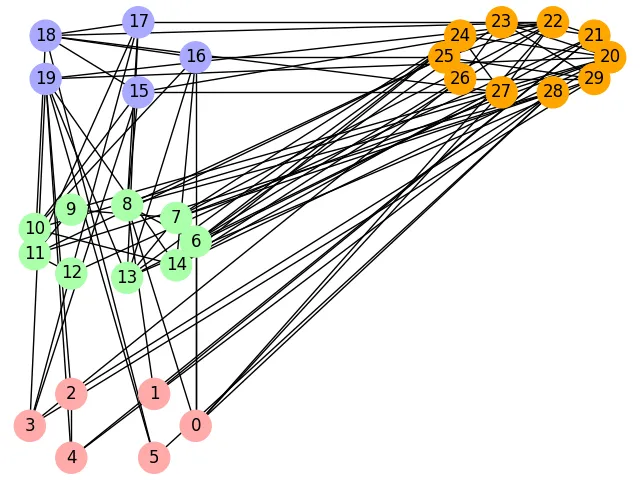
为了说明该解决方案,我们创建一个包含30个随机节点的小图。
这些层是带有其他属性的子图:(
x,
y)坐标和颜色。这些坐标用于相对定位2D网格中的层。
import networkx as nx
graph = nx.fast_gnp_random_graph(30, .2, seed=2019)
layers = [
(nx.Graph(), (0, 0), "#ffaaaa"),
(nx.Graph(), (0, 1), "#aaffaa"),
(nx.Graph(), (0, 2), "#aaaaff"),
(nx.Graph(), (1, 2), "#ffa500"),
]
每个层都填充有主图的节点。
在这里,我们决定将节点列表分成不同的范围(图中节点的起始和结束索引)。
每个节点的颜色存储在color_map变量中。
在图形绘制过程中稍后使用此变量。
import itertools
ranges = [(0, 6), (6, 15), (15, 20), (20, 30)]
color_map = []
for (layer, coord, color), (start, end) in zip(layers, ranges):
layer.add_nodes_from(itertools.islice(graph.nodes, start, end))
color_map.extend([color for _ in range(start, end)])
然后,我们可以计算每个节点的位置。
根据层坐标,节点位置会发生位移。
all_pos = {}
for layer, (sx, sy), color in layers:
pos = nx.circular_layout(layer, scale=2)
for node in pos:
all_pos[node] = pos[node]
all_pos[node] += (10 * sx, 10 * sy)
我们现在可以绘制图表:
import matplotlib.pyplot as plt
nx.draw(graph, all_pos, node_size=500, node_color=color_map, with_labels=True)
plt.show()
结果如下图所示:
当然,你可以使用三维网格,并使用投影来获得类似于三维的预览。
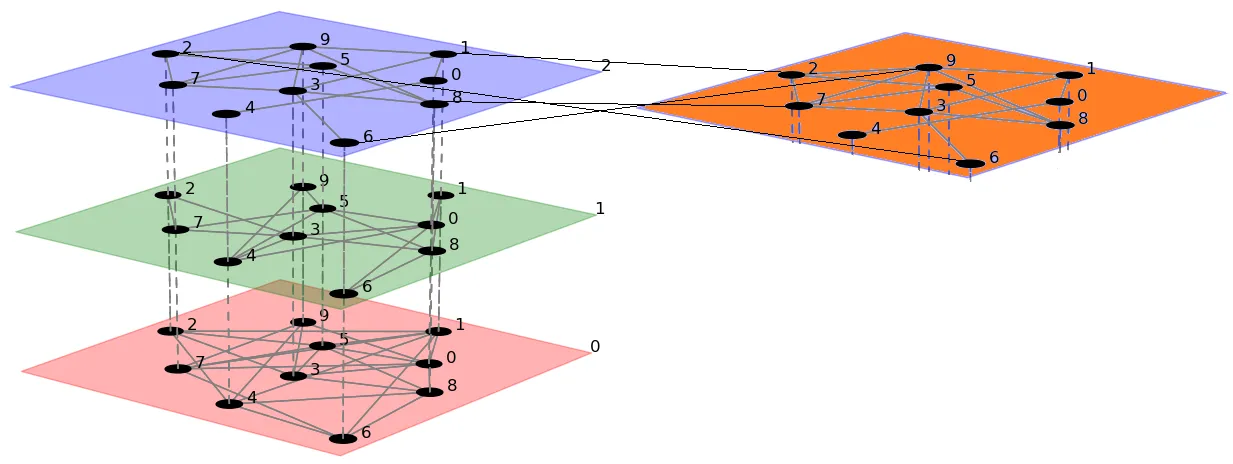
pymnet/visuals/drawnet.py),一个图形只是一堆垂直层叠在一起。你不能将两个堆叠在一起并排放置。 - Laurent LAPORTE