我正在尝试为圆柱的每个面着色,但是我不确定如何进行操作,我已经尝试了以下方法:
for i in range(10):
    col.append([])


for i in range(10):
    for j in range(20):

        col[i].append(plt.cm.Blues(0.4))

 ax.plot_surface(X, Y, Z,facecolors = col,edgecolor = "red")
我希望每个面都有自己的颜色,所以我认为我需要为2D数组中每个面提供一个颜色数组。 但是这会导致错误:
in plot_surface
    colset.append(fcolors[rs][cs])
IndexError: list index out of range
以下是完整代码:
import numpy as np
from matplotlib import cm
from matplotlib import pyplot as plt
from mpl_toolkits.mplot3d import Axes3D
from scipy.linalg import norm
from mpl_toolkits.mplot3d.art3d import Poly3DCollection


fig = plt.figure()
ax = fig.add_subplot(111, projection='3d')
origin = np.array([0, 0, 0])

#axis and radius
p0 = np.array([1, 3, 2])
p1 = np.array([8, 5, 9])
R = 5

#vector in direction of axis
v = p1 - p0

#find magnitude of vector
mag = norm(v)

#unit vector in direction of axis
v = v / mag

#make some vector not in the same direction as v
not_v = np.array([1, 0, 0])
if (v == not_v).all():
not_v = np.array([0, 1, 0])

#make vector perpendicular to v
n1 = np.cross(v, not_v)
#normalize n1
n1 /= norm(n1)

#make unit vector perpendicular to v and n1
n2 = np.cross(v, n1)

#surface ranges over t from 0 to length of axis and 0 to 2*pi
t = np.linspace(0, mag, 200)
theta = np.linspace(0, 2 * np.pi, 100)

#use meshgrid to make 2d arrays
t, theta = np.meshgrid(t, theta)

#generate coordinates for surface
X, Y, Z = [p0[i] + v[i] * t + R * np.sin(theta) * n1[i] + R * np.cos(theta) *       n2[i] for i in [0, 1, 2]]
col = []
for i in range(10):
    col.append([])
for i in range(10):
    for j in range(20):

        col[i].append(plt.cm.Blues(0.4))

ax.plot_surface(X, Y, Z,facecolors = col,edgecolor = "red")

#plot axis
ax.plot(*zip(p0, p1), color = 'red')
ax.set_xlim(0, 10)
ax.set_ylim(0, 10)
ax.set_zlim(0, 10)
plt.axis('off')
ax.axes.get_xaxis().set_visible(False)
ax.axes.get_yaxis().set_visible(False)
plt.show()
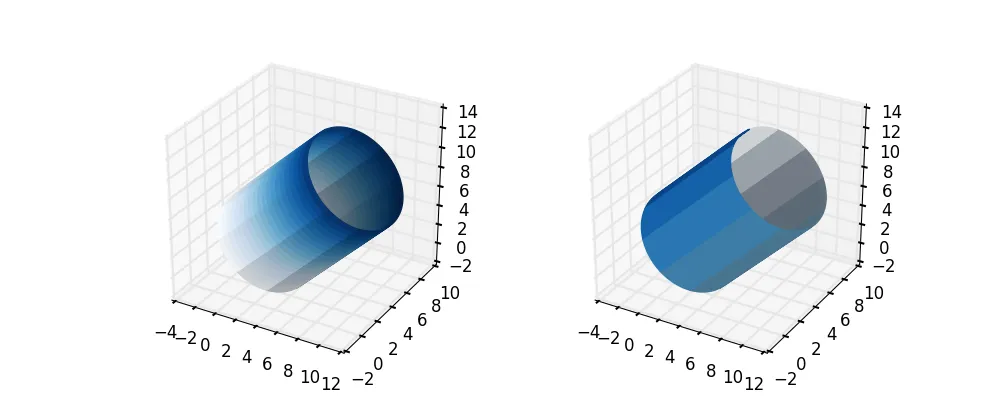
plot_surface()中添加shade=False。 - Bart