我试图解决一个具有线性约束的非线性数学优化问题。为此,我想在三维空间中可视化这些约束条件以查看出现了什么情况,以及为什么对于某些约束条件参数,我可以得到可行的解而对其他约束条件则不行。
为了实现这一目标,我想使用 Python 中的 matplotlib 生成三维表面(由于所有的约束都是线性的,所以表面是平面)。
然而,如果没有图示标签很难识别哪个表面属于哪个约束条件。这让我想寻找一种在图中添加带颜色图例的方法。
我知道在2D图形中已经有一种方法可以做到这一点,在ax.plot() 或 ax.scatter() 方法中可以直接添加标签。但是尝试相同的方法并不能实现在 ax.plot_surface(X, Y, Z, label = 'mylabel') 中添加标签。
以下是完整的脚本:
from mpl_toolkits import mplot3d
from mpl_toolkits.mplot3d import Axes3D
import matplotlib.pyplot as plt
import numpy as np
fig = plt.figure()
ax = plt.axes(projection='3d')
plt.rcParams['legend.fontsize'] = 10
# First constraint
g2 = np.linspace(-5,5,2)
g3 = np.linspace(-5,5,2)
G2,G3 = np.meshgrid(g2,g3)
G4_1 = -1.18301270189222 - 0.5*G2 + 0.5*G3
ax = fig.gca(projection='3d')
c1 = ax.plot_surface(G2, G3, G4_1, label = "c1")
# Second
G3, G4 = np.meshgrid(g2, g3)
G2 = G3
c2 = ax.plot_surface(G2, G3, G4, label = "c2")
# Third
G2,G3 = np.meshgrid(g2,g3)
G4 = (0.408248290463863*G2 + 0.408248290463863*G3 -0.707106781186548)/1.63299316185545
c3 = ax.plot_surface(G2, G3, G4, label = "c3")
# And forth
G4 = (1.04903810567666 - (0.288675134594813*G2 + 0.288675134594813*G3))/0.577350269189626
c4 = ax.plot_surface(G2, G3, G4, label="c4")
ax.legend() # -> error : 'AttributeError: 'Poly3DCollection' object has no attribute '_edgecolors2d''
# labeling the figure
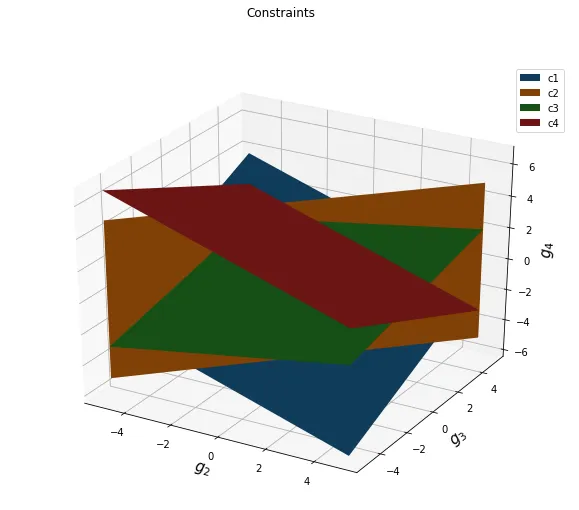
fig.suptitle("Constraints")
#plt.xlabel('g2', fontsize=14)
#plt.ylabel('g3', fontsize=14)
ax.set_xlabel(r'$g_2$', fontsize=15, rotation=60)
ax.set_ylabel('$g_3$', fontsize=15, rotation=60)
ax.set_zlabel('$g_4$', fontsize=15, rotation=60)
plt.savefig('Constraints.jpg')
plt.show()
于是结果如下图所示。
正如您所看到的,没有办法确定哪个曲面属于哪个约束条件,我想要实现的是一个类似这里的图例。
我阅读了这个问题的答案,但它在此处无效,因为我有多个曲面。尝试后,它仅显示一个标签,而不是四个标签。
所以我的问题是,是否有一种方法可以向我的 ax.plot_surface 添加图例或任何其他合适的 hack?