在matplotlib中,如何从元组列表绘制3D表面

9

我试图从一个(X,Y,Z)元组列表绘制一个3D表面,数据如下,我不确定如何将其提供给matplotlib:

[(60,5,'121'), (61,5,'103'),  (62,5,'14.8'), (63,5,'48.5'),
(64,5,'57.5'), (65,5,'75.7'), (66,5,'89.6'), (67,5,'55.3'),
(68,5,'63.3'), (69,5,'118'),  (70,5,'128'),  (71,5,'105'),
(72,5,'115'),  (73,5,'104'),  (74,5,'134'),  (75,5,'123'),
(76,5,'66.3'), (77,5,'132'),  (78,5,'145'),  (79,5,'115'),
(80,5,'38.2'), (81,5,'10.4'), (82,5,'18.4'), (83,5,'87'),
(84,5,'86.7'), (85,5,'78.9'), (86,5,'89.9'), (87,5,'108'),
(88,5,'57.1'), (89,5,'51.1'), (90,5,'69.1'), (91,5,'59.8'),
(60,6,'48.9'), (61,6,'33.3'), (62,6,'-19.2'),(63,6,'-17.5'),
(64,6,'-6.5'), (65,6,'75.7'), (66,6,'89.6'), (67,6,'55.3'),
(68,6,'99.8'), (69,6,'156'),  (70,6,'141'),  (71,6,'54.1'),
(72,6,'66.1'), (73,6,'98.9'), (74,6,'155'),  (75,6,'146'),
(76,6,'111'),  (77,6,'132'),  (78,6,'145'),  (79,6,'97.3'),
(80,6,'101'),  (81,6,'59.4'), (82,6,'70.4'), (83,6,'142'),
(84,6,'145'),  (85,6,'140'),  (86,6,'56.9'), (87,6,'77.8'),
(88,6,'21.1'), (89,6,'27.1'), (90,6,'48.1'), (91,6,'41.8')]
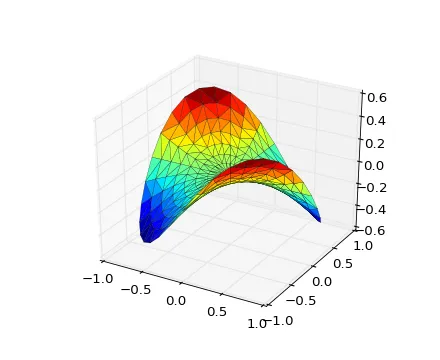
理想情况下,我希望它看起来像这样:

在此输入图片描述


你可能想要看一下https://dev59.com/Ymct5IYBdhLWcg3wAY3q或https://dev59.com/5XA75IYBdhLWcg3w8-HZ?rq=1 - Dr. Jan-Philip Gehrcke
我在这里发布了另一个例子:https://dev59.com/pWox5IYBdhLWcg3wf0Xl#30539444。此外,请查看这些相关/类似/重复的帖子:https://dev59.com/pWox5IYBdhLWcg3wf0Xl,https://dev59.com/Ymct5IYBdhLWcg3wAY3q,http://stackoverflow.com/q/26074542/3585557,http://stackoverflow.com/q/28389606/3585557,https://dev59.com/zYnda4cB1Zd3GeqPAYnU。 - Steven C. Howell
你的 Z 是一个浮点数的字符串表示。 - smci
1个回答

11

这是一种方法来完成它。

from mpl_toolkits.mplot3d import Axes3D
from scipy.interpolate import griddata
import matplotlib.pyplot as plt
import numpy as np

data = [(60, 5, '121'), (61, 5, '103'), (62, 5, '14.8'), (63, 5, '48.5'), (64, 5, '57.5'), (65, 5, '75.7'), (66, 5, '89.6'), (67, 5, '55.3'), (68, 5, '63.3'), (69, 5, '118'), (70, 5, '128'), (71, 5, '105'), (72, 5, '115'), (73, 5, '104'), (74, 5, '134'), (75, 5, '123'), (76, 5, '66.3'), (77, 5, '132'), (78, 5, '145'), (79, 5, '115'), (80, 5, '38.2'), (81, 5, '10.4'), (82, 5, '18.4'), (83, 5, '87'), (84, 5, '86.7'), (85, 5, '78.9'), (86, 5, '89.9'), (87, 5, '108'), (88, 5, '57.1'), (89, 5, '51.1'), (90, 5, '69.1'), (91, 5, '59.8'), (60, 6, '48.9'), (61, 6, '33.3'), (62, 6, '-19.2'), (63, 6, '-17.5'), (64, 6, '-6.5'), (65, 6, '75.7'), (66, 6, '89.6'), (67, 6, '55.3'), (68, 6, '99.8'), (69, 6, '156'), (70, 6, '141'), (71, 6, '54.1'), (72, 6, '66.1'), (73, 6, '98.9'), (74, 6, '155'), (75, 6, '146'), (76, 6, '111'), (77, 6, '132'), (78, 6, '145'), (79, 6, '97.3'), (80, 6, '101'), (81, 6, '59.4'), (82, 6, '70.4'), (83, 6, '142'), (84, 6, '145'), (85, 6, '140'), (86, 6, '56.9'), (87, 6, '77.8'), (88, 6, '21.1'), (89, 6, '27.1'), (90, 6, '48.1'), (91, 6, '41.8')]
x, y, z = zip(*data)
z = map(float, z)
grid_x, grid_y = np.mgrid[min(x):max(x):100j, min(y):max(y):100j]
grid_z = griddata((x, y), z, (grid_x, grid_y), method='cubic')

fig = plt.figure()
ax = fig.gca(projection='3d')
ax.plot_surface(grid_x, grid_y, grid_z, cmap=plt.cm.Spectral)
plt.show()

1
以上代码(Python 3.3)出现以下Traceback错误: - aag
文件"C:\Python33\PyPostgres\test.py",第10行,在<module>中: grid_z = griddata((x, y), z, (grid_x, grid_y), method='cubic') - aag
文件“C:\ Python33 \ lib \ site-packages \ scipy \ interpolate \ ndgriddata.py”,第210行,griddata函数中, rescale = rescale。 interpnd.pyx的第840行,scipy.interpolate.interpnd.CloughTocher2DInterpolator.__init__(scipy \ interpolate \ interpnd.c:9507), interpnd.pyx的第78行,scipy.interpolate.interpnd.NDInterpolatorBase.__init__(scipy \ interpolate \ interpnd.c:2372), interpnd.pyx的第120行,scipy.interpolate.interpnd.NDInterpolatorBase._check_init_shape(scipy \ interpolate \ interpnd.c:3039), IndexError:元组索引超出范围。 - aag
3
@aag,你需要执行z = list(map(float, z)),因为在Python3中,map函数是一个生成器。 - M4rtini
@M4rtini,感谢你提供有关griddata的提示。这是一个非常出色的实现。 - Steven C. Howell

网页内容由stack overflow 提供, 点击上面的
可以查看英文原文,
原文链接