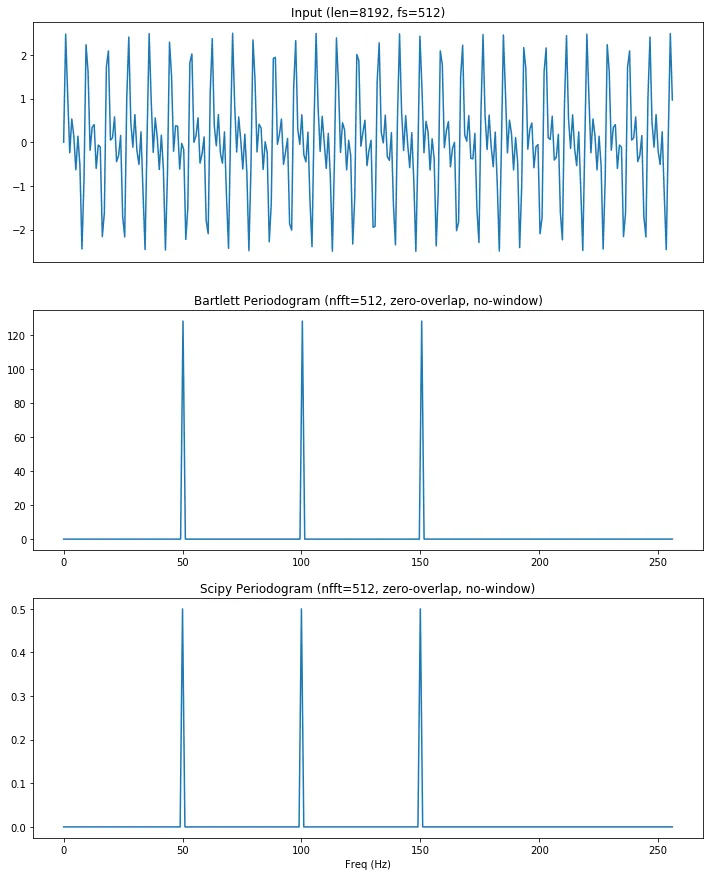
我正在尝试基于Bartlett's method的描述,在Python中实现周期图,并通过将重叠设置为0,使用窗口='boxcar'(矩形窗口)与Scipy的结果进行比较。然而,我的结果存在一些比例因子的偏差。有人能指出我的代码有什么问题吗?谢谢
import numpy as np
import matplotlib.pyplot as plt
from scipy import signal


def my_bartlett_periodogram(x, fs, nperseg, nfft):
    nsegments = len(x) // nperseg
    psd = np.zeros(nfft)
    for segment in x.reshape(nsegments, nperseg):
        psd += np.abs(np.fft.fft(segment))**2 / nfft
    psd[0] = 0   # important!!
    psd /= nsegments
    psd = psd[0 : nfft//2]
    freq = np.linspace(0, fs/2, nfft//2)
    return freq, psd

def plot_output(t, x, f1, psd1, f2, psd2):
    fig, axs = plt.subplots(3,1, figsize=(12,15))
    axs[0].plot(t[:300], x[:300])
    axs[1].plot(freq1, psd1)
    axs[2].plot(freq2, psd2)
    axs[0].set_title('Input (len=8192, fs=512)')
    axs[1].set_title('Bartlett Periodogram (nfft=512, zero-overlap, no-window)')
    axs[2].set_title('Scipy Periodogram (nfft=512, zero-overlap, no-window)')
    axs[0].set_xticks([])
    axs[2].set_xlabel('Freq (Hz)')
    plt.show()

# Run
fs = nfft = nperseg = 512
t = np.arange(8192) / fs
x = np.sin(2*np.pi*50*t) + np.sin(2*np.pi*100*t) + np.sin(2*np.pi*150*t)
freq1, psd1 = my_bartlett_periodogram(x, fs, nperseg, nfft)
freq2, psd2 = signal.welch(x, fs, nperseg=nperseg, nfft=nfft, window='boxcar', noverlap=0)
plot_output(t, x, freq1, psd1, freq2, psd2)