我有这些数据:
我以这种方式绘制每一列:
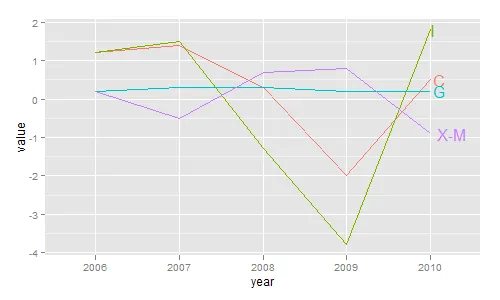
从这个链接获取: https://learnr.wordpress.com/2010/01/03/directlabels-adding-direct-labels-to-ggplot2-and-lattice-plots/ 但R的响应是:
F.acc

date   Specie       15%       30%       45%       60%       75%      -15%      -30%      -45%      -60%
1  1990 Acciughe 0.0750600 0.0750600 0.0750600 0.0750600 0.0750600 0.0750600 0.0750600 0.0750600 0.0750600
2  1991 Acciughe 0.0667800 0.0667800 0.0667800 0.0667800 0.0667800 0.0667800 0.0667800 0.0667800 0.0667800
3  1992 Acciughe 0.0805100 0.0805100 0.0805100 0.0805100 0.0805100 0.0805100 0.0805100 0.0805100 0.0805100
4  1993 Acciughe 0.1095500 0.1095500 0.1095500 0.1095500 0.1095500 0.1095500 0.1095500 0.1095500 0.1095500
5  1994 Acciughe 0.1134600 0.1134600 0.1134600 0.1134600 0.1134600 0.1134600 0.1134600 0.1134600 0.1134600
6  1995 Acciughe 0.1331100 0.1331100 0.1331100 0.1331100 0.1331100 0.1331100 0.1331100 0.1331100 0.1331100
7  1996 Acciughe 0.2086200 0.2086200 0.2086200 0.2086200 0.2086200 0.2086200 0.2086200 0.2086200 0.2086200
8  1997 Acciughe 0.2628700 0.2628700 0.2628700 0.2628700 0.2628700 0.2628700 0.2628700 0.2628700 0.2628700
9  1998 Acciughe 0.3672200 0.3672200 0.3672200 0.3672200 0.3672200 0.3672200 0.3672200 0.3672200 0.3672200
10 1999 Acciughe 0.6350800 0.6350800 0.6350800 0.6350800 0.6350800 0.6350800 0.6350800 0.6350800 0.6350800
11 2000 Acciughe 1.1240200 1.1240200 1.1240200 1.1240200 1.1240200 1.1240200 1.1240200 1.1240200 1.1240200
12 2001 Acciughe 1.4046208 1.4046208 1.4046208 1.4046208 1.4046208 1.4046208 1.4046208 1.4046208 1.4046208
13 2002 Acciughe 1.1272634 1.1272634 1.1272634 1.1272634 1.1272634 1.1272634 1.1272634 1.1272634 1.1272634
14 2003 Acciughe 1.0459767 1.0459767 1.0459767 1.0459767 1.0459767 1.0459767 1.0459767 1.0459767 1.0459767
15 2004 Acciughe 0.8642741 0.8642741 0.8642741 0.8642741 0.8642741 0.8642741 0.8642741 0.8642741 0.8642741
16 2005 Acciughe 0.8023208 0.8023208 0.8023208 0.8023208 0.8023208 0.8023208 0.8023208 0.8023208 0.8023208
17 2006 Acciughe 0.6522259 0.6522259 0.6522259 0.6522259 0.6522259 0.6522259 0.6522259 0.6522259 0.6522259
18 2007 Acciughe 0.8190483 0.8190483 0.8190483 0.8190483 0.8190483 0.8190483 0.8190483 0.8190483 0.8190483
19 2008 Acciughe 0.7726650 0.7726650 0.7726650 0.7726650 0.7726650 0.7726650 0.7726650 0.7726650 0.7726650
20 2009 Acciughe 0.9027550 0.9027550 0.9027550 0.9027550 0.9027550 0.9027550 0.9027550 0.9027550 0.9027550
21 2010 Acciughe 1.2112933 1.2112933 1.2112933 1.2112933 1.2112933 1.2112933 1.2112933 1.2112933 1.2112933
22 2011 Acciughe 1.2698780 1.2698780 1.2698780 1.2698780 1.2698780 1.2698780 1.2698780 1.2698780 1.2698780
23 2012 Acciughe 0.8832933 0.8832933 0.8832933 0.8832933 0.8832933 0.8832933 0.8832933 0.8832933 0.8832933
24 2013 Acciughe 0.8047100 0.8047100 0.8047100 0.8047100 0.8047100 0.8047100 0.8047100 0.8047100 0.8047100
25 2014 Acciughe 0.8047100 0.8047100 0.8047100 0.8047100 0.8047100 0.8047100 0.8047100 0.8047100 0.8047100
26 2015 Acciughe 0.8047100 0.8047100 0.8047100 0.8047100 0.8047100 0.8047100 0.8047100 0.8047100 0.8047100
27 2016 Acciughe 0.8167934 0.8288767 0.8409600 0.8530434 0.8651267 0.7926267 0.7805434 0.7684600 0.7563767
28 2017 Acciughe 0.8407934 0.8768767 0.9129600 0.9490434 0.9851267 0.7686267 0.7325434 0.6964600 0.6603767
29 2018 Acciughe 0.8647934 0.9248767 0.9849600 1.0450434 1.1051267 0.7446267 0.6845434 0.6244600 0.5643767
30 2019 Acciughe 0.8887934 0.9728767 1.0569600 1.1410434 1.2251267 0.7206267 0.6365434 0.5524600 0.4683767
31 2020 Acciughe 0.9127934 1.0208767 1.1289600 1.2370434 1.3451267 0.6966267 0.5885434 0.4804600 0.3723767
32 2021 Acciughe 0.9247100 1.0447100 1.1647100 1.2847100 1.4047100 0.6847100 0.5647100 0.4447100 0.3247100
33 2022 Acciughe 0.9247100 1.0447100 1.1647100 1.2847100 1.4047100 0.6847100 0.5647100 0.4447100 0.3247100
34 2023 Acciughe 0.9247100 1.0447100 1.1647100 1.2847100 1.4047100 0.6847100 0.5647100 0.4447100 0.3247100
35 2024 Acciughe 0.9247100 1.0447100 1.1647100 1.2847100 1.4047100 0.6847100 0.5647100 0.4447100 0.3247100
36 2025 Acciughe 0.9247100 1.0447100 1.1647100 1.2847100 1.4047100 0.6847100 0.5647100 0.4447100 0.3247100
37 2026 Acciughe 0.9247100 1.0447100 1.1647100 1.2847100 1.4047100 0.6847100 0.5647100 0.4447100 0.3247100
38 2027 Acciughe 0.9247100 1.0447100 1.1647100 1.2847100 1.4047100 0.6847100 0.5647100 0.4447100 0.3247100
39 2028 Acciughe 0.9247100 1.0447100 1.1647100 1.2847100 1.4047100 0.6847100 0.5647100 0.4447100 0.3247100
40 2029 Acciughe 0.9247100 1.0447100 1.1647100 1.2847100 1.4047100 0.6847100 0.5647100 0.4447100 0.3247100
41 2030 Acciughe 0.9247100 1.0447100 1.1647100 1.2847100 1.4047100 0.6847100 0.5647100 0.4447100 0.3247100
        -75%      -44%
1  0.0750600 0.0750600
2  0.0667800 0.0667800
3  0.0805100 0.0805100
4  0.1095500 0.1095500
5  0.1134600 0.1134600
6  0.1331100 0.1331100
7  0.2086200 0.2086200
8  0.2628700 0.2628700
9  0.3672200 0.3672200
10 0.6350800 0.6350800
11 1.1240200 1.1240200
12 1.4046208 1.4046208
13 1.1272634 1.1272634
14 1.0459767 1.0459767
15 0.8642741 0.8642741
16 0.8023208 0.8023208
17 0.6522259 0.6522259
18 0.8190483 0.8190483
19 0.7726650 0.7726650
20 0.9027550 0.9027550
21 1.2112933 1.2112933
22 1.2698780 1.2698780
23 0.8832933 0.8832933
24 0.8047100 0.8047100
25 0.8047100 0.8047100
26 0.8047100 0.8047100
27 0.7442934 0.7690569
28 0.6242934 0.6982424
29 0.5042934 0.6274279
30 0.3842934 0.5566135
31 0.2642934 0.4857990
32 0.2047100 0.4506376
33 0.2047100 0.4506376
34 0.2047100 0.4506376
35 0.2047100 0.4506376
36 0.2047100 0.4506376
37 0.2047100 0.4506376
38 0.2047100 0.4506376
39 0.2047100 0.4506376
40 0.2047100 0.4506376
41 0.2047100 0.4506376
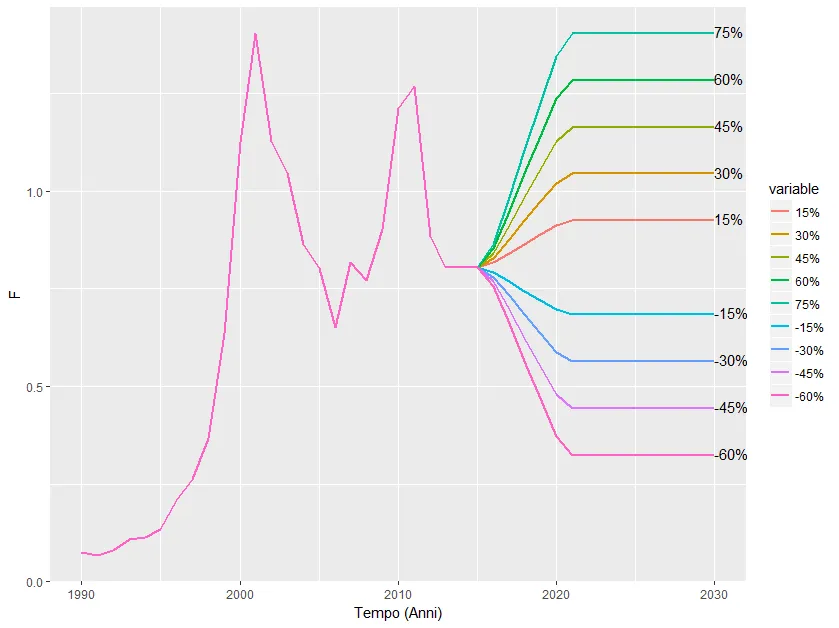
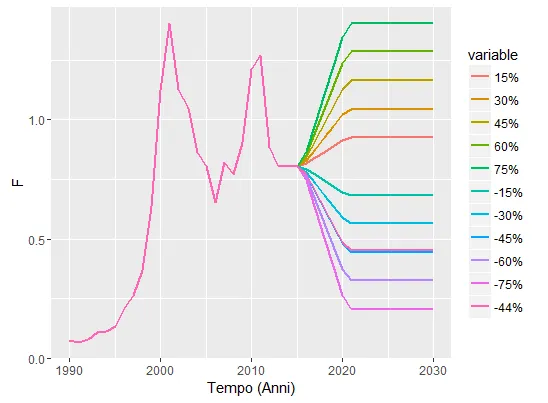
我以这种方式绘制每一列:
library(ggplot2)
library(reshape2)

melt.F.acc <- melt(F.acc,id.vars=c('date','Specie'),variable.names='series')

p <- ggplot(melt.F.acc, aes(date,value)) +
  geom_line(aes(colour = variable),size=1)+
  theme_gray()+
  ylab("F")+
  xlab("Tempo (Anni)")
结果是:
install.packages("directlabels", repos = "http://r-forge.r-project.org")
library(directlabels)
 direct.label(p, list(last.points, hjust = 0.7,
     vjust = 1))
从这个链接获取: https://learnr.wordpress.com/2010/01/03/directlabels-adding-direct-labels-to-ggplot2-and-lattice-plots/ 但R的响应是:
Error in eval(expr, envir, enclos) : could not find function "eval"
你知道在折线图上标注标签的其他可能性吗?例如,像这样: