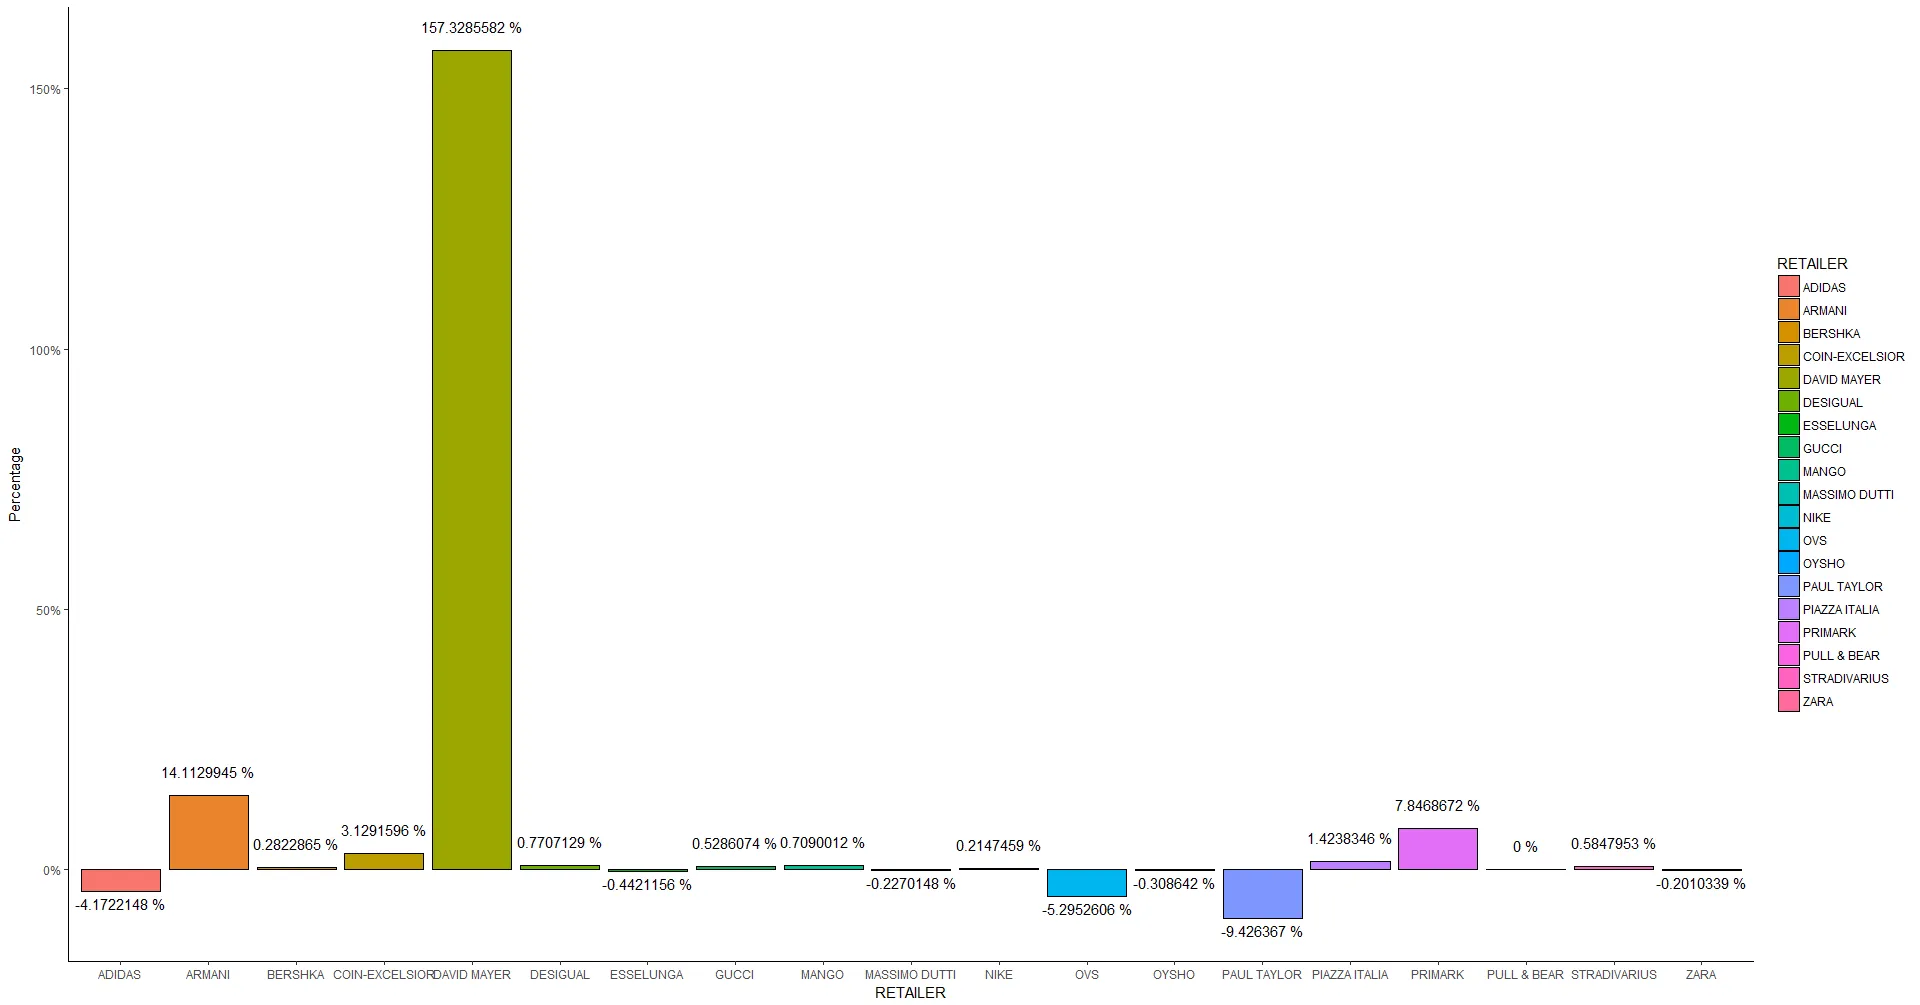
我的代码生成了这个图表:
代码:
ggplot(areas, aes(x = RETAILER, y = Difference), label=sprintf("%0.2f", round(areas$Difference, digits = 2))) +
geom_bar(stat = "identity", aes(fill = RETAILER), colour = "black") +
scale_y_continuous("Percentage", labels = percent_format()) +
geom_text(aes(label = paste(Difference * 100, "%"),
              vjust = ifelse(Difference >= 0, -1.5, 1.5))) +
theme_classic()
我已经找到了代码,可以使数据标签正确地放置在每个条形图的上方或下方,但是似乎无法将值四舍五入到小数点后两位。
我尝试过使用
round(areas, 2)和sprintf("%0.2f")等方法,但是无论我尝试什么都不起作用,我确信我错过了一些简单的东西。我做错了什么?
更新:
在Roland的“鼓励”下,我现在几乎解决了这个问题;现在的问题是我现在失去了百分号:
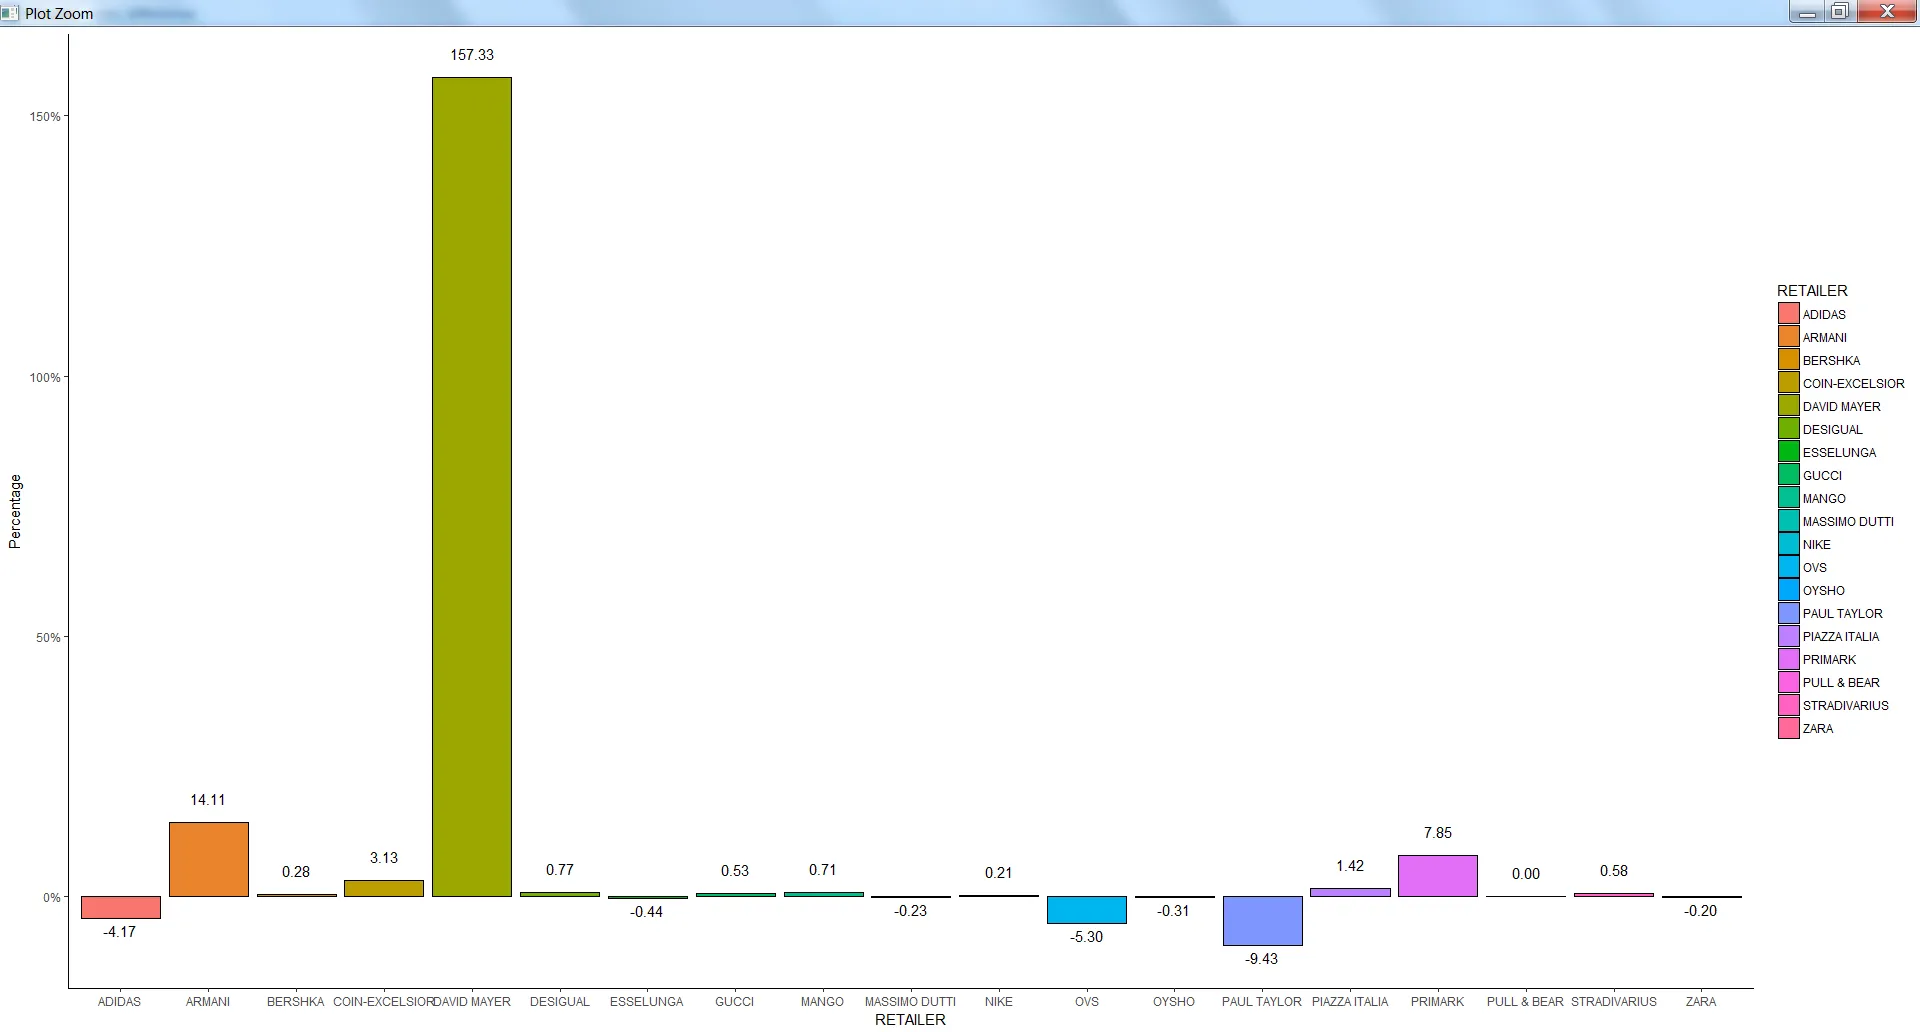
我如何把它们找回来?
更新后的代码:
ggplot(areas, aes(x = RETAILER, y = Difference)) +
  geom_bar(stat = "identity", aes(fill = RETAILER), colour = "black") +
  scale_y_continuous("Percentage", labels = percent_format()) +
  geom_text(aes(label = sprintf("%0.2f", areas$Difference * 100, "%"),
                vjust = ifelse(Difference >= 0, -1.5, 1.5))) +
  theme_classic()
paste0(round(差异值, 4) * 100, "%")。 - bouncyballgeom_text(aes(label = paste(Difference * 100, "%")。那里没有任何四舍五入。 - Rolandsprintf("%0.2f %%", Difference * 100)。如果您不想在ggplot2中出现意外行为,请跳过areas$。 - Roland