在 R 的 grid 包中,如何使用 viewport 合并 ggplot2 图形?

3
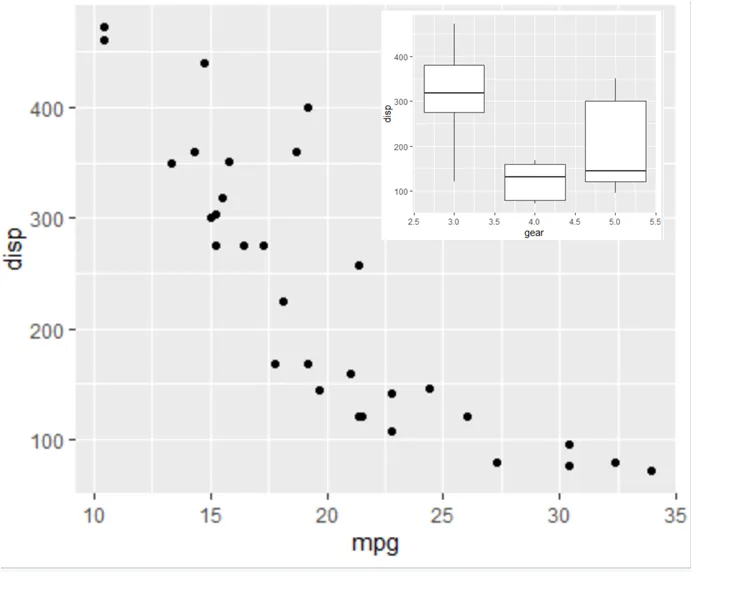
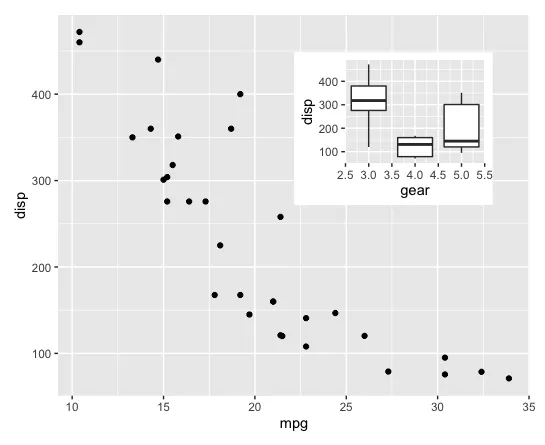
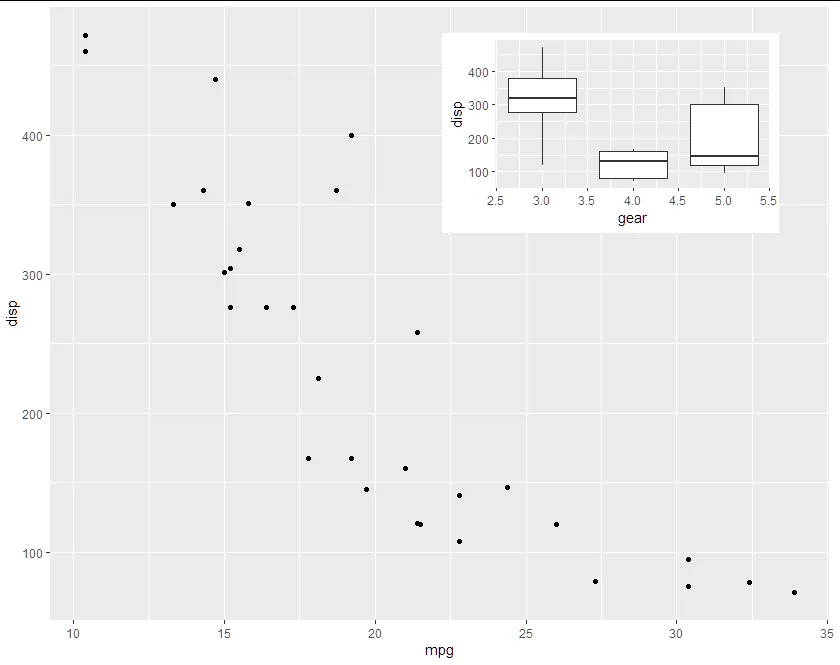
我想要将geom_point()和geom_boxplot()合并成一个图表,如附图所示。下面的代码无法工作。有人可以帮忙吗?谢谢!
library(grid)
library(ggplot2)
grid.newpage()
vp <- viewport(x=0.5,y=0.5,width = 1,height = 1)
push.Viewport(vp)
ggplot(mtcars) + geom_point(aes(mpg, disp))

vp_sub <- viewport(x=0.5,y=0.7,width=0.3,height=0.3)
push.viewport(vp_sub)
ggplot(mtcars) + geom_boxplot(aes(gear, disp, group = gear))

enter image description here

3个回答

4
也许你可以使用 patchwork 包,这里有一个部分描述了你的问题。
library(tidyverse)
library(patchwork)

p1 <- ggplot(mtcars) + geom_point(aes(mpg, disp))
p2 <- ggplot(mtcars) + geom_boxplot(aes(gear, disp, group = gear))

p1 + inset_element(
  p2, 
  left = 0.5, 
  bottom = 0.5, 
  right = unit(1, 'npc') - unit(1, 'cm'), 
  top = unit(1, 'npc') - unit(1, 'cm')
)

patchwork_insert_element


4
除了使用patchwork::inset_element之外,第二个选项是通过ggplot2::annotation_custom添加您的箱线图。但是,与patchwork::inset_element不同的是,您必须设置主要图表数据范围的绝对坐标位置:
library(ggplot2)

bp <- ggplot(mtcars) + geom_boxplot(aes(gear, disp, group = gear))

base <- ggplot(mtcars) + 
  geom_point(aes(mpg, disp)) 

base +
  annotation_custom(grob = ggplotGrob(bp), xmin = 22.5, ymin = 250)


3

使用 viewport,您可以这样完成您的任务。如果您想要保存为PNG文件,则只需注释掉 #png("my_plot.png") 这一行。

library(grid)
library(ggplot2)
grid.newpage()

p1 <- ggplot(mtcars) + geom_point(aes(mpg, disp))
p2 <- ggplot(mtcars) + geom_boxplot(aes(gear, disp, group = gear))


vp <- viewport(x=0.5,y=0.5,width = 1,height = 1)vp_sub <- viewport(x=0.73,y=0.8,width=0.4,height=0.3)

#png("my_plot.png")
print(p1, vp=vp)
print(p2, vp=vp_sub)
dev.off()

enter image description here


网页内容由stack overflow 提供, 点击上面的
可以查看英文原文,
原文链接