有没有像MATLAB一样能够绘制瀑布图的Python模块?我尝试了谷歌搜索'numpy waterfall'、'scipy waterfall'和'matplotlib waterfall',但是没有找到任何相关内容。
4个回答
22
你可以使用 PolyCollection 类在 matplotlib 中制作瀑布图。请参阅此特定的 example 以获取有关如何使用此类进行瀑布图的更多详细信息。
此外,您可能会发现这篇 blog post 有用,因为作者展示了在某些特定情况下(取决于所选的视角)可能会出现一些“视觉错误”。
以下是使用 matplotlib 制作的瀑布图示例(来自博客文章的图片):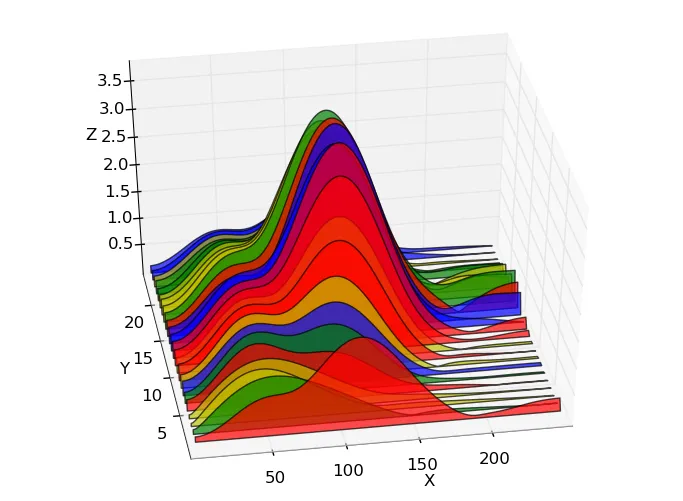
(来源:austringer.net)
此外,您可能会发现这篇 blog post 有用,因为作者展示了在某些特定情况下(取决于所选的视角)可能会出现一些“视觉错误”。
以下是使用 matplotlib 制作的瀑布图示例(来自博客文章的图片):
(来源:austringer.net)
- gcalmettes
6
Have a look at mplot3d:
# copied from
# http://matplotlib.sourceforge.net/mpl_examples/mplot3d/wire3d_demo.py

from mpl_toolkits.mplot3d import axes3d
import matplotlib.pyplot as plt
import numpy as np

fig = plt.figure()
ax = fig.add_subplot(111, projection='3d')
X, Y, Z = axes3d.get_test_data(0.05)
ax.plot_wireframe(X, Y, Z, rstride=10, cstride=10)

plt.show()
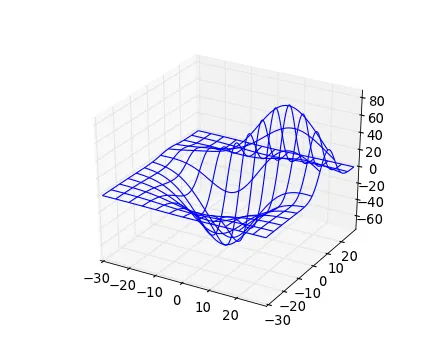
我不知道如何获得与Matlab一样好的结果。
如果您想了解更多,还可以看看MayaVi:http://mayavi.sourceforge.net/
- moooeeeep
4
我已经生成了一个函数,可以在matplotlib中复制matlab waterfall的行为。也就是说:
因此,给定输入矩阵n,m矩阵X、Y和Z,该函数循环遍历n、m之间的最小维度,以将每个瀑布图独立线作为上述线段的线集绘制出来。
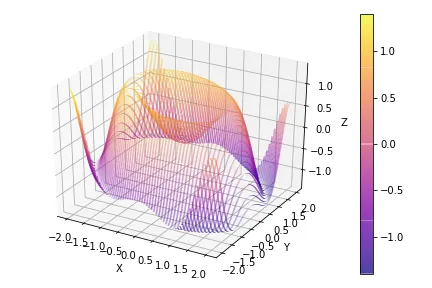
因此,只需使用与 matplotlib 表面图相同的输入矩阵即可轻松生成类似 Matlab waterfall 的图形:
- 它将3D形状生成为许多独立和平行的2D曲线
- 其颜色来自于z值中的一个colormap
因此,给定输入矩阵n,m矩阵X、Y和Z,该函数循环遍历n、m之间的最小维度,以将每个瀑布图独立线作为上述线段的线集绘制出来。
def waterfall_plot(fig,ax,X,Y,Z,**kwargs):
    '''
    Make a waterfall plot
    Input:
        fig,ax : matplotlib figure and axes to populate
        Z : n,m numpy array. Must be a 2d array even if only one line should be plotted
        X,Y : n,m array
        kwargs : kwargs are directly passed to the LineCollection object
    '''
    # Set normalization to the same values for all plots
    norm = plt.Normalize(Z.min().min(), Z.max().max())
    # Check sizes to loop always over the smallest dimension
    n,m = Z.shape
    if n>m:
        X=X.T; Y=Y.T; Z=Z.T
        m,n = n,m

    for j in range(n):
        # reshape the X,Z into pairs
        points = np.array([X[j,:], Z[j,:]]).T.reshape(-1, 1, 2)
        segments = np.concatenate([points[:-1], points[1:]], axis=1)
        # The values used by the colormap are the input to the array parameter
        lc = LineCollection(segments, cmap='plasma', norm=norm, array=(Z[j,1:]+Z[j,:-1])/2, **kwargs)
        line = ax.add_collection3d(lc,zs=(Y[j,1:]+Y[j,:-1])/2, zdir='y') # add line to axes

    fig.colorbar(lc) # add colorbar, as the normalization is the same for all
    # it doesent matter which of the lc objects we use
    ax.auto_scale_xyz(X,Y,Z) # set axis limits
因此,只需使用与 matplotlib 表面图相同的输入矩阵即可轻松生成类似 Matlab waterfall 的图形:
import numpy as np; import matplotlib.pyplot as plt
from matplotlib.collections import LineCollection
from mpl_toolkits.mplot3d import Axes3D

# Generate data
x = np.linspace(-2,2, 500)
y = np.linspace(-2,2, 60)
X,Y = np.meshgrid(x,y)
Z = np.sin(X**2+Y**2)-.2*X
# Generate waterfall plot
fig = plt.figure()
ax = fig.add_subplot(111, projection='3d')
waterfall_plot(fig,ax,X,Y,Z,linewidth=1.5,alpha=0.5)
ax.set_xlabel('X'); ax.set_ylabel('Y'); ax.set_zlabel('Z')
fig.tight_layout()
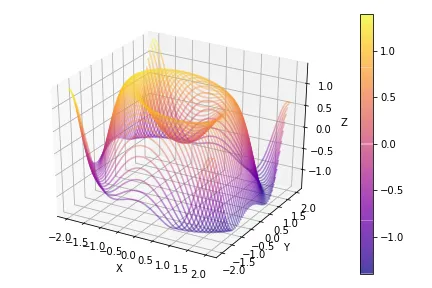
该函数假设在生成网格时,x数组最长,默认情况下线的y坐标固定,x坐标变化。然而,如果y数组的大小更大,则矩阵被转置,产生具有固定x的线。因此,使用倒置的大小(len(x)=60和len(y)=500)生成网格如下:
要了解**kwargs参数的可能性,请参阅LineCollection类文档及其set_方法。
- OriolAbril
4
您可以通过以下方式获得类似维基百科类型的瀑布图表:
import numpy as np
import pandas as pd

def waterfall(series):
    df = pd.DataFrame({'pos':np.maximum(series,0),'neg':np.minimum(series,0)})
    blank = series.cumsum().shift(1).fillna(0)
    df.plot(kind='bar', stacked=True, bottom=blank, color=['r','b'])
    step = blank.reset_index(drop=True).repeat(3).shift(-1)
    step[1::3] = np.nan
    plt.plot(step.index, step.values,'k')

test = pd.Series(-1 + 2 * np.random.rand(10), index=list('abcdefghij'))
waterfall(test)
- kadee
2
Chris Moffitt写了一篇很好的文章,其中有更多的解释(他显然受到了上面代码的启发):请参见http://pbpython.com/waterfall-chart.html - kadee
1不错的例子,但请将瀑布图与瀑布图表进行比较。在我看来,前者更有趣。 - Bastian Ebeling
网页内容由stack overflow 提供, 点击上面的可以查看英文原文,
原文链接
原文链接