我有一个图表,想要用箭头和标签注释x轴上的特定位置:
- 箭头尖端的位置需要在数据坐标系中精确指定。
- 箭头应该是垂直的,因此箭头钝端(以及文本标签)的x坐标也应在数据坐标系中精确指定。
- 然而,我最好能够相对于轴边界框指定箭头钝端的y位置,而不是数据。
我的目前解决方案涉及在数据坐标中指定箭头尖端和标签的位置:
import numpy as np
from matplotlib import pyplot as plt
from matplotlib.transforms import blended_transform_factory
x = np.random.randn(10000)
r = 3
label = 'foo'
arrowprops = dict(fc='r', ec='k')
def make_example_plot():
fig, ax = plt.subplots(1, 1)
ax.hold(True)
counts, edges, patches = ax.hist(x)
return fig, ax
fig, ax = make_example_plot()
lo, hi = ax.get_ylim()
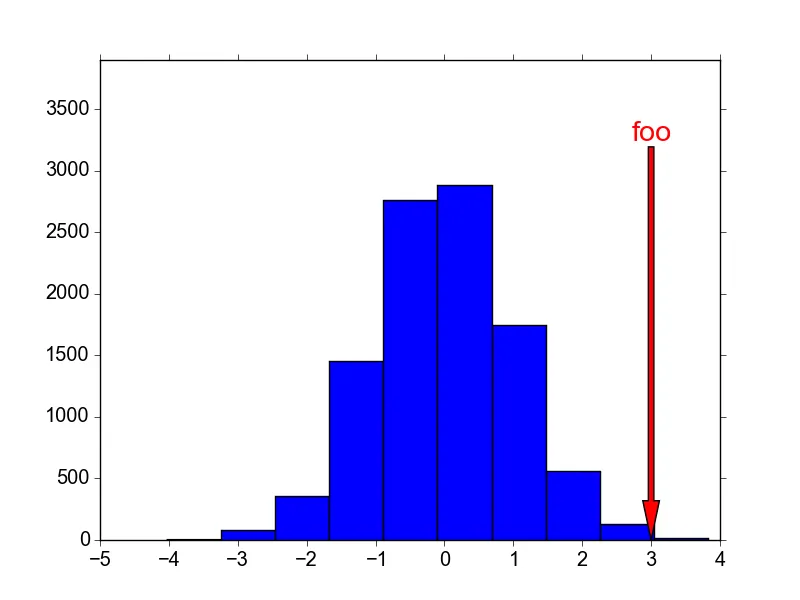
ax.annotate(label, xy=(r, 0), xycoords='data',
xytext=(r, hi * 1.1), textcoords='data', fontsize='xx-large',
ha='center', va='center', color='r', arrowprops=arrowprops)
ax.set_ylim(0, hi * 1.3)
无论我如何缩放或平移 y 轴,我都希望标签在 y 方向上保持恒定位置。使用混合的 x-y 变换传递给 ax.text,可以实现纯文本标签的所需效果。
fig, ax = make_example_plot()
tform = blended_transform_factory(ax.transData, ax.transAxes)
ax.text(r, 0.9, label, fontsize='xx-large', color='r', transform=tform)
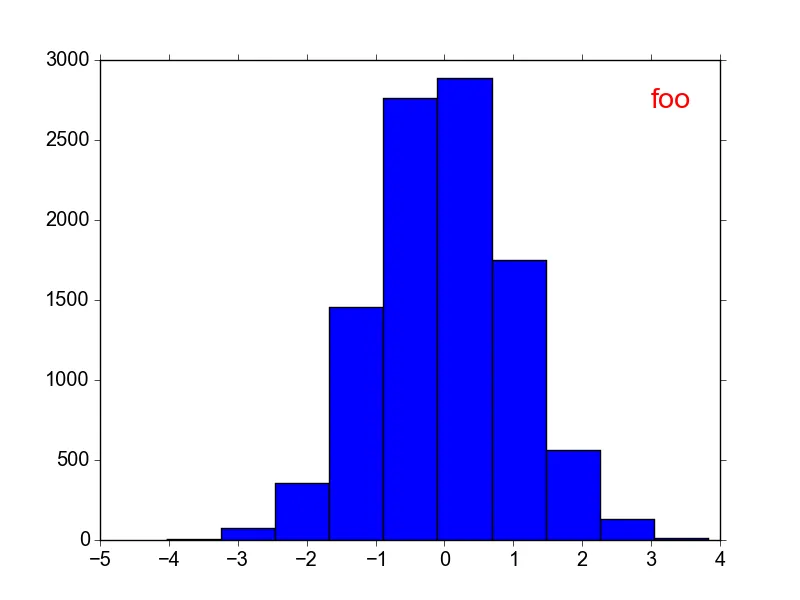
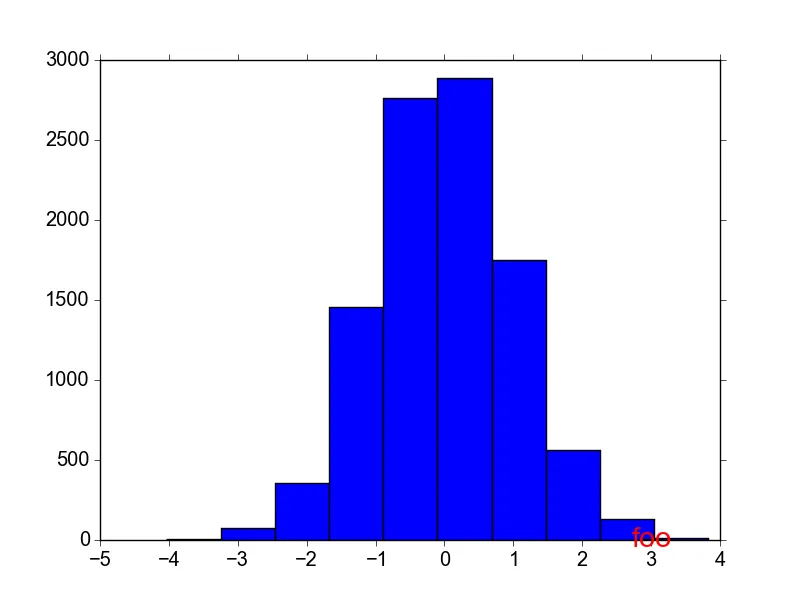
如果您重现这个图形并对其进行平移或缩放,您会发现文字相对于坐标轴边界框在x方向上移动,但在y方向上保持固定位置。当然这仍然无法给我所需的箭头。我本来希望可以使用ax.annotate相同的方法,但似乎没有效果:
fig, ax = make_example_plot()
tform = blended_transform_factory(ax.transData, ax.transAxes)
ax.annotate(label, xy=(r, 0), xycoords='data', transform=tform,
            xytext=(r, 0.9), textcoords='data', fontsize='xx-large',
            ha='center', va='center', color='r', arrowprops=arrowprops)
xycoords=和textcoords=参数的选项。 - ali_m