Matplotlib: 使用两个反向缩放的x轴绘制x/y坐标

3
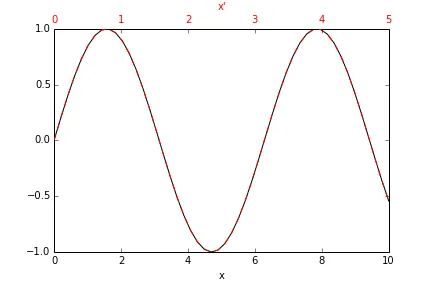
我想创建一个特殊的图,有两个x轴和一个y轴。底部的x轴值增加,顶部的x轴值减少。我有一个x-y对,想要在一个x轴上绘制y,在另一个具有不同刻度的顶部x'轴上绘制(x' = f(x))
在我的情况下,xx'之间的转换是x' = c/x,其中c是一个常数。我找到了一个例子here,处理这种类型的转换。不幸的是,这个例子对我没用(没有错误消息,输出只是没有被转换)。
我正在使用python 3.3matplotlib 1.3.0rc4 (numpy 1.7.1)。有人知道用matplotlib方便的方法吗?

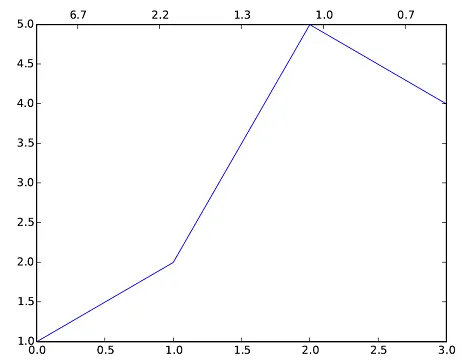
编辑: 我在stackoverflow上找到了一个答案(https://dev59.com/JGkv5IYBdhLWcg3wjxhl#10517481),这帮助我得到了所需的图表。由于声誉限制,我无法立即发布图片,如果有人感兴趣,我会在这里发布答案。

2个回答

2
我不确定这是否符合您的要求,但无论如何,以下是内容:

我不确定这是否符合您的要求,但无论如何,以下是内容:

import pylab as py
x = py.linspace(0,10)
y = py.sin(x)
c = 2.0

# First plot
ax1 = py.subplot(111)
ax1.plot(x,y , "k")
ax1.set_xlabel("x")

# Second plot
ax2 = ax1.twiny()
ax2.plot(x / c, y, "--r")
ax2.set_xlabel("x'", color='r')
for tl in ax2.get_xticklabels():
    tl.set_color('r')

示例

我猜你的意思是:

我有一个x-y对,想要在一个x轴上绘制y,在另一个具有不同比例的x'轴下方绘制。

如果我理解错误,我向你道歉。


嘿,哇,回答好快。原则上,最终的图形应该是这样的,唯一的问题是:x' = c/x,它是一种反比关系 - 如果我通过在ax2.plot(x / c, y, "--r")中交换c和x来修改您的示例,则两个函数不再相等。 - JHK
当然不是,你仍在绘制相同的y数据,但针对完全不同的比例尺。因此它仍将是一个正弦函数,但随着x->inf而被拉伸。你在x=0处也会遇到问题。试着用铅笔和纸画出你想要的东西。 - Greg
1
我认为可以肯定地说,这里发布帖子的大多数人都知道函数如何根据其参数和绘制轴的不同而表现出不同的行为。我只是有些难以表达清楚,很抱歉。正如问题中的编辑所指出的那样,我已经找到了答案。我会尽快发布它,并解释一下问题的具体内容。 - JHK

1
以下代码的输出对我来说已经令人满意 - 除非有更方便的方法,否则我将坚持使用它。
import matplotlib.pyplot as plt
import numpy as np

plt.plot([1,2,5,4])
ax1 = plt.gca()
ax2 = ax1.twiny()

new_tick_locations = np.array([.1, .3, .5, .7,.9]) # Choosing the new tick locations
inv = ax1.transData.inverted()
x = []

for each in new_tick_locations:
    print(each)
    a = inv.transform(ax1.transAxes.transform([each,1])) # Convert axes-x-coordinates to data-x-coordinates
    x.append(a[0])

c = 2
x = np.array(x)
def tick_function(X):
    V =  c/X
    return ["%.1f" % z for z in V]
ax2.set_xticks(new_tick_locations) # Set tick-positions on the second x-axes
ax2.set_xticklabels(tick_function(x)) # Convert the Data-x-coordinates of the first x-axes to the Desired x', with the tick_function(X)

A possible way to get to the desired plot.


网页内容由stack overflow 提供, 点击上面的
可以查看英文原文,
原文链接