我有一组配对的列表(a, b),我想用Python的matplotlib库将其绘制成实际的x-y坐标。目前,它会生成两个图表,其中列表的索引作为x坐标,第一个图表的y值是配对中的a,第二个图表的y值是配对中的b。
为了澄清,我的数据看起来像这样:li = [(a,b), (c,d), ... , (t, u)],我想要一个一行代码的简洁调用plt.plot()。
如果我不需要一行代码的话,我可以很容易地这样做:
如何让matplotlib将这些对作为x-y坐标进行绘制?
为了澄清,我的数据看起来像这样:li = [(a,b), (c,d), ... , (t, u)],我想要一个一行代码的简洁调用plt.plot()。
如果我不需要一行代码的话,我可以很容易地这样做:
xs = [x[0] for x in li]
ys = [x[1] for x in li]
plt.plot(xs, ys)
如何让matplotlib将这些对作为x-y坐标进行绘制?
样本数据
# sample data
li = list(zip(range(1, 14), range(14, 27)))

li → [(1, 14), (2, 15), (3, 16), (4, 17), (5, 18), (6, 19), (7, 20), (8, 21), (9, 22), (10, 23), (11, 24), (12, 25), (13, 26)]
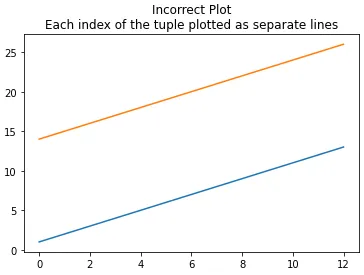
错误的情节
plt.plot(li)
plt.title('Incorrect Plot:\nEach index of the tuple plotted as separate lines')
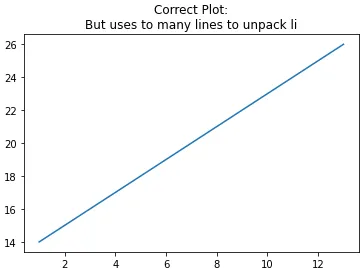
期望的情节
这个产生了正确的情节,但是使用了太多行代码来解包li。我需要用一行代码解包和绘制,而不是多个列表推导。
xs = [x[0] for x in li]
ys = [x[1] for x in li]
plt.plot(xs, ys)
plt.title('Correct Plot:\nBut uses to many lines to unpack li')
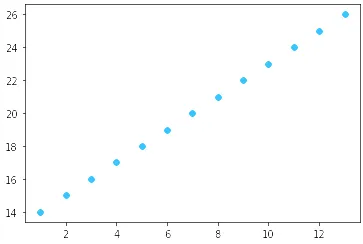
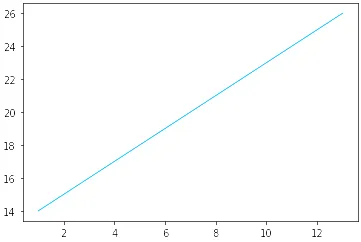
zip对象解包到绘图API中。 - Trenton McKinney