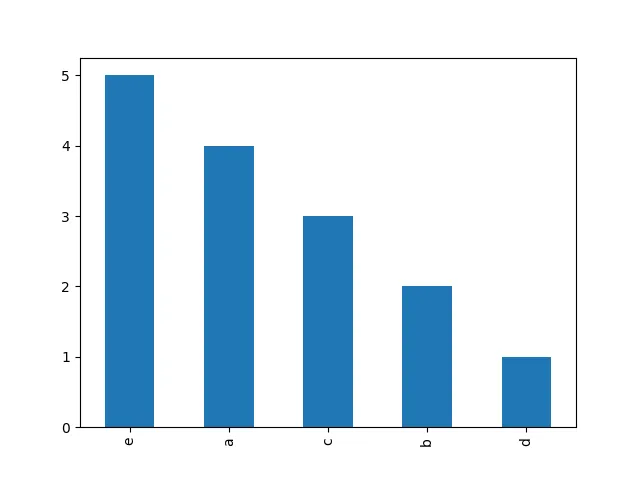
我用以下代码制作了一个简单的直方图:
a = ['a', 'a', 'a', 'a', 'b', 'b', 'c', 'c', 'c', 'd', 'e', 'e', 'e', 'e', 'e']
pd.Series(a).value_counts().plot('bar')
虽然这是绘制频率直方图的简明方法,但我不确定如何自定义图表,即:
- 添加标题
- 添加坐标轴标签
- 对x轴上的值进行排序
我用以下代码制作了一个简单的直方图:
a = ['a', 'a', 'a', 'a', 'b', 'b', 'c', 'c', 'c', 'd', 'e', 'e', 'e', 'e', 'e']
pd.Series(a).value_counts().plot('bar')
虽然这是绘制频率直方图的简明方法,但我不确定如何自定义图表,即:
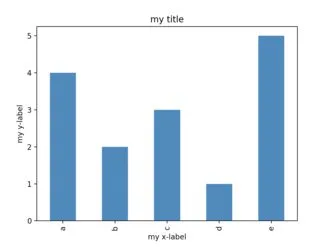
Series.plot(或 DataFrame.plot)返回一个 matplotlib axis 对象,它公开了几种方法。例如:
a = ['a', 'a', 'a', 'a', 'b', 'b', 'c', 'c', 'c', 'd', 'e', 'e', 'e', 'e', 'e']
ax = pd.Series(a).value_counts().sort_index().plot('bar')
ax.set_title("my title")
ax.set_xlabel("my x-label")
ax.set_ylabel("my y-label")
n.b.: pandas 使用 matplotlib 作为依赖项,并暴露了 matplotlib 对象和 API。您可以通过 import matplotlib.pyplot as plt; ax = plt.subplots(1,1,1) 得到相同的结果。如果您同时创建多个图表,您会发现 ax.<method> 比模块级别的 plt.title('my title') 更方便,因为它定义了您想要更改的 哪个 图表的标题,并且您可以利用 ax 对象上的自动完成功能。
matplotlib来自定义它。你可以看到我使用了.sort_index()来对x轴标签进行排序。import matplotlib.pyplot as plt
a = ['a', 'a', 'a', 'a', 'b', 'b', 'c', 'c', 'c', 'd', 'e', 'e', 'e', 'e', 'e']
pd.Series(a).value_counts().sort_index().plot(kind='bar')
plt.title('My Title')
plt.xlabel('My X Label')
如评论中所述,您现在可以使用title、xlabel和ylabel参数(并使用kind参数来选择绘图类型):
a = ['a', 'a', 'a', 'a', 'b', 'b', 'c', 'c', 'c', 'd', 'e', 'e', 'e', 'e', 'e']
pd.Series(a).value_counts().plot(kind='bar', title="Your Title", xlabel="X Axis", ylabel="Y Axis")