OxyPlot散点图中的自定义颜色范围

4

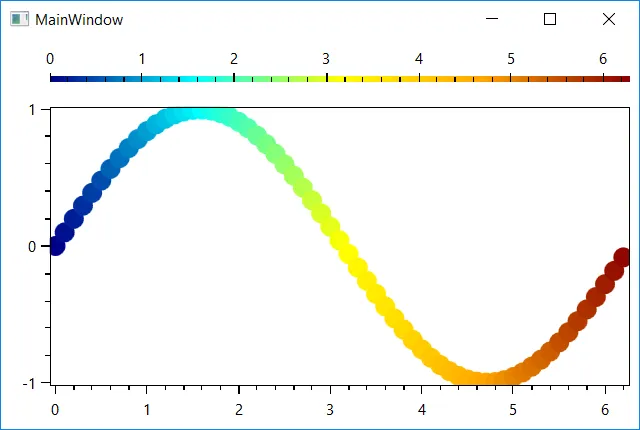
我一直在尝试使用OxyPlot实现散点图和线系列的叠加。基本上,我想要对我的散点图上的一些点进行着色编码。

我已经创建了下面带有散点图和线系列的图形:

enter image description here

上述点的颜色是按照此处的教程创建的。基本上,我添加了一个RangeColorAxis。此图的X轴范围从0到1,并创建以下颜色:
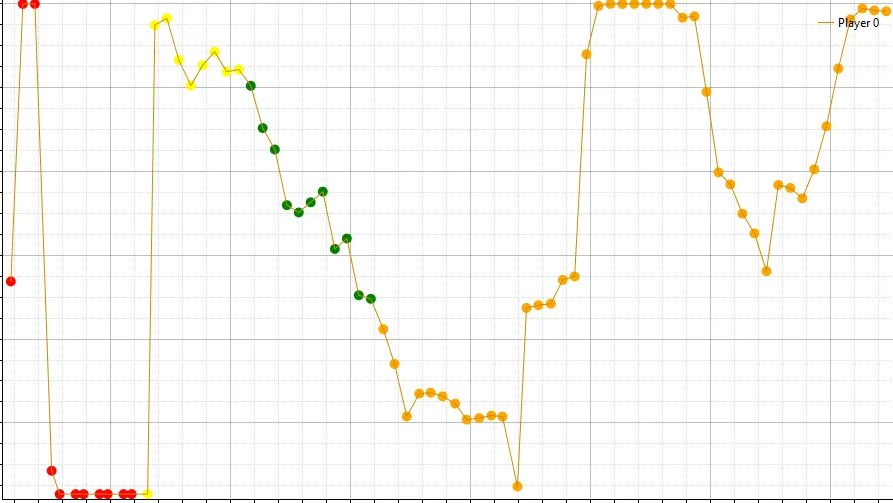
        var customAxis = new RangeColorAxis { Key = "customColors" };
        customAxis.AddRange(0, 0.1, OxyColors.Red);
        customAxis.AddRange(0.1, 0.2, OxyColors.Yellow);
        customAxis.AddRange(0.2, 0.3, OxyColors.Green);
        customAxis.AddRange(0.3, 1, OxyColors.Orange);
        customAxis.AddRange(1, 1.1, OxyColors.Blue);
        OxyPlotModel.Axes.Add(customAxis);

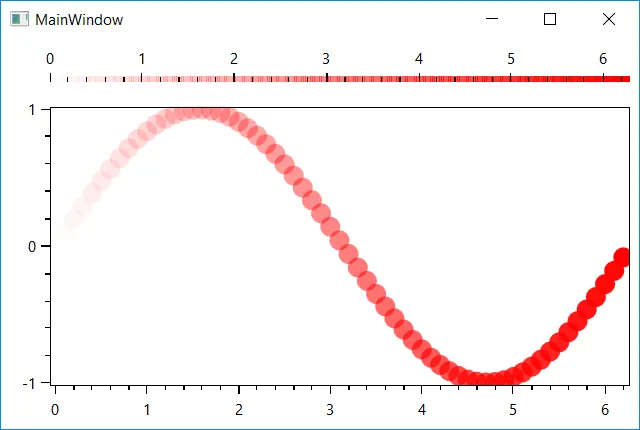
但是现在,我也想在上面的图中添加一些颜色渐变。例如,从0.0到0.1,我希望颜色从浅红色逐渐过渡到深红色。从0.1到0.2,我希望过渡从浅黄色到明黄色。从0.2到0.3,我希望过渡从浅绿色到深绿色。以此类推。在Oxyplot中是否可以实现这一点?谢谢。
1个回答

5

使用 LinearColorAxis

图片描述

public partial class MainWindow : Window
{
    public PlotModel Model { get; set; }

    public MainWindow()
    {
        InitializeComponent();

        Model = new PlotModel();

        var axis1 = new LinearColorAxis();
        axis1.Key = "ColorAxis";
        axis1.Maximum = 2 * Math.PI;
        axis1.Minimum = 0;
        axis1.Position = AxisPosition.Top;
        Model.Axes.Add(axis1);

        var s1 = new ScatterSeries();
        s1.ColorAxisKey = "ColorAxis";
        s1.MarkerSize = 8;
        s1.MarkerType = MarkerType.Circle;

        for (double x = 0; x <= 2 * Math.PI; x += 0.1)
            s1.Points.Add(new ScatterPoint(x, Math.Sin(x), double.NaN, x));

        Model.Series.Add(s1);

        DataContext = this;
    }
}

编辑:您也可以定义自己的调色板:

输入图像描述

axis1.Palette.Colors.Clear();

for (int i = 0; i < 256; i++)
    axis1.Palette.Colors.Add(OxyColor.FromArgb((byte)i, 255, 0, 0));

嘿,jstreet,能否指定LinearColorAxis中范围内数值的颜色?以你的示例为例,在0到2 * PI之间,它会从蓝色过渡到红色。如果我只想在0到2 * PI之间从浅红色过渡到深红色,该怎么办? - Mantracker
请查看我的编辑 - jsanalytics

网页内容由stack overflow 提供, 点击上面的
可以查看英文原文,
原文链接