我正在尝试更改堆叠条形图中组的绘图顺序。其他人也提出了类似的问题,例如这里和这里,但我似乎无法让任何类似的东西起作用。
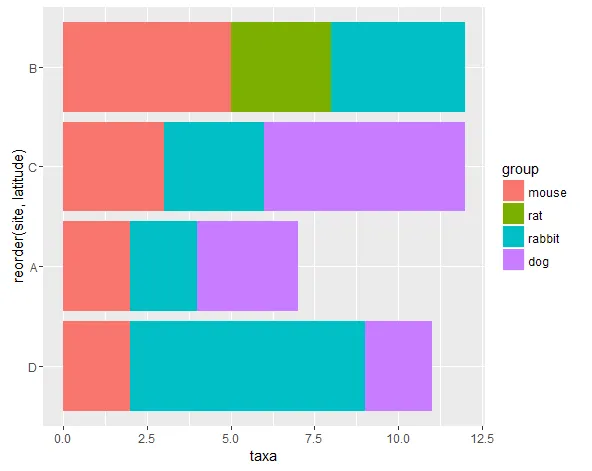
以下是一个玩具示例。我有一个数据框,其中包含多个站点、它们的纬度以及每个站点的老鼠、大鼠、兔子和狗的数量。我想制作一个堆叠条形图,其中站点按纬度排序在y轴上,动物数量在x轴上。我希望动物条按特定顺序绘制(例如按大小从小到大)。
我编写了代码,认为应该可以工作,但我努力规定动物的绘图顺序只重新排列图例,而不是图本身。
感谢您的提前帮助。
以下是一个玩具示例。我有一个数据框,其中包含多个站点、它们的纬度以及每个站点的老鼠、大鼠、兔子和狗的数量。我想制作一个堆叠条形图,其中站点按纬度排序在y轴上,动物数量在x轴上。我希望动物条按特定顺序绘制(例如按大小从小到大)。
我编写了代码,认为应该可以工作,但我努力规定动物的绘图顺序只重新排列图例,而不是图本身。
library(ggplot2)
df <- read.table(header=TRUE, text="site    group   taxa    latitude
A   mouse   2   -20
                               B    rat 3   -17
                               C    dog 6   -18
                               D    rabbit  7   -24
                               A    rabbit  2   -20
                               B    mouse   5   -17
                               C    rabbit  3   -18
                               D    dog 2   -24
                               A    dog 3   -20
                               B    rabbit  4   -17
                               C    mouse   3   -18
                               D    mouse   2   -24")

plotOrder <- c("mouse","rat","rabbit","dog") #set the order in which I want to plot the groups
df$group <- factor(as.character(df$group), levels = plotOrder) #reorders the legend & colour, not plotting order

plot1 <-
  ggplot(data = df,
         aes(x=reorder(site, latitude), y=taxa, fill=group))+
  geom_bar(aes(order = group), stat="identity") +
  coord_flip()
plot1
感谢您的提前帮助。