D3 在这方面并没有提供太多帮助。使用原生的 JavaScript 就可以相对容易地实现。首先,让我们在笛卡尔坐标空间中创建一个 GeoJSON 椭圆。接下来,我们可以使用 Haversine 公式来画出椭圆。
- 在笛卡尔坐标空间中创建一个 GeoJSON 椭圆。
这非常简单,我使用的方法是计算给定角度处椭圆的半径。使用这些极坐标,我们可以拼接成一个椭圆。可以很容易地找到椭圆在给定点的半径公式,我使用了这个source,它给出了:
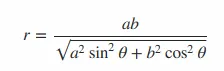
因此,我们可以轻松地迭代一系列角度,计算该角度处的半径,然后将极坐标转换为笛卡尔坐标。可能是这样的:
function createEllipse(a,b,x=0,y=0,rotation=0) {
rotation = rotation / 180 * Math.PI;
var n = n = Math.ceil(36 * (Math.max(a/b,b/a)));
var coords = [];
for (var i = 0; i <= n; i++) {
var θ = Math.PI*2/n*i + rotation;
var r = a * b / Math.sqrt(a*a*Math.sin(θ)*Math.sin(θ) + b*b*Math.cos(θ)*Math.cos(θ));
x1 = x + Math.cos(θ-rotation) * r;
y1 = y + Math.sin(θ-rotation) * r;
coords.push([x1,y1]);
}
return { "type":"Polygon", "coordinates":[coords] };
}
注意:a/b表示轴(以像素为单位),x/y表示中心点(以像素为单位),rotation表示旋转角度(以度数为单位)
这是一个简短的代码片段:
var geojson = createEllipse(250,50,200,200,45);
var svg = d3.select("body")
.append("svg")
.attr("width",600)
.attr("height",500);
var path = d3.geoPath();
svg.append("path")
.datum(geojson)
.attr("d",path);
function createEllipse(a,b,x=0,y=0,rotation=0) {
rotation = rotation / 180 * Math.PI;
var n = n = Math.ceil(36 * (Math.max(a/b,b/a)));
var coords = [];
for (var i = 0; i <= n; i++) {
var θ = Math.PI*2/n*i + rotation;
var r = a * b / Math.sqrt(a*a*Math.sin(θ)*Math.sin(θ) + b*b*Math.cos(θ)*Math.cos(θ));
x1 = x + Math.cos(θ-rotation) * r;
y1 = y + Math.sin(θ-rotation) * r;
coords.push([x1,y1]);
}
return { "type":"Polygon", "coordinates":[coords] };
}
<script src="https://cdnjs.cloudflare.com/ajax/libs/d3/4.13.0/d3.min.js"></script>
- 应用哈弗曼公式。
我知道的关于哈弗曼和相关函数的最佳资源之一是在Moveable Type Scripts上。我几年前得到的公式来自那里,并进行了一些美化修改。我不会在这里分解公式,因为链接的参考资料应该很有用。
因此,我们可以采用极坐标而非计算笛卡尔坐标,并将角度作为方位角、半径作为距离,在哈弗曼公式中使用,这应该相对简单。
这可能看起来像:
function createEllipse(a,b,x=0,y=0,rotation=0) {
var k = Math.ceil(36 * (Math.max(a/b,b/a)));
var coords = [];
for (var i = 0; i <= k; i++) {
var angle = Math.PI*2 / k * i + rotation
var r = a * b / Math.sqrt(a*a*Math.sin(angle)*Math.sin(angle) + b*b*Math.cos(angle)*Math.cos(angle));
coords.push(getLatLong([x,y],angle,r));
}
return { "type":"Polygon", "coordinates":[coords] };
}
function getLatLong(center,angle,radius) {
var rEarth = 6371000;
x0 = center[0] * Math.PI / 180;
y0 = center[1] * Math.PI / 180;
var y1 = Math.asin( Math.sin(y0)*Math.cos(radius/rEarth) + Math.cos(y0)*Math.sin(radius/rEarth)*Math.cos(angle) );
var x1 = x0 + Math.atan2(Math.sin(angle)*Math.sin(radius/rEarth)*Math.cos(y0), Math.cos(radius/rEarth)-Math.sin(y0)*Math.sin(y1));
y1 = y1 * 180 / Math.PI;
x1 = x1 * 180 / Math.PI;
return [x1,y1];
}
var geojson = createEllipse(500000,1000000,50,70);
var geojson2 = createEllipse(500000,1000000)
var svg = d3.select("body")
.append("svg")
.attr("width",600)
.attr("height",400);
var g = svg.append("g");
var projection = d3.geoMercator().translate([300,200]).scale(600/Math.PI/2);
var path = d3.geoPath().projection(projection);
g.selectAll("path")
.data([geojson,geojson2])
.enter().append("path")
.attr("d", path);
g.selectAll("circle")
.data([[50,70],[0,0]])
.enter().append("circle")
.attr("cx", function(d) { return projection(d)[0] })
.attr("cy", function(d) { return projection(d)[1] })
.attr("r", 4)
.attr("fill","orange");
<script src="https://cdnjs.cloudflare.com/ajax/libs/d3/4.13.0/d3.min.js"></script>
注意:a/b轴的单位为米,x、y、旋转角度的单位为度。
这是一个相当无聊的演示,也许
这个简单的演示更好:
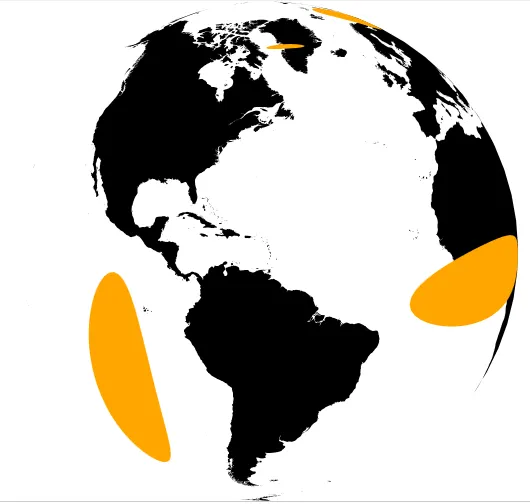
我使用的公式假设地球是一个球体,而不是一个椭球体,这可能导致距离误差高达0.3%。但是,根据地图比例尺,这通常会小于笔画宽度。
我可能需要尝试制作一个特别具有视觉挑战性的Tissot指数版本。
片段使用默认参数值,这些值与IE不兼容。示例块提供IE支持。
var angle = Math.PI*2 / k * i + rotation,这有点无意义。另一方面,在从笛卡尔坐标系转换为球面坐标系时,您没有考虑旋转。将其从前面的语句中删除,而是将其移动到getLatLong([x, y], angle + rotation, r)中即可解决问题。 - altocumulus