D3 - 大型GeoJSON文件使用投影方式无法正确绘制地图

5
我在绘制从data.seattle.gov获取的GeoJSON文件时遇到了问题。具体来说,我正在使用可以在此处找到的Shape文件。我将其转换为GeoJSON文件,并在下面提供了一个小样本。
我希望通过使用D3来绘制出西雅图不同的选区(实际上我并不确定应该是什么,这就是为什么我要绘制它的原因...哈哈),但是尽管路径正确计算,但由于某种原因它没有正确显示。
我已经在这里托管了我的示例。当我有时间设置它时,我将尝试用jsFiddle替换此链接。问题是,GeoJSON文件相当大,所以我认为jsFiddle可能不理想。
我的代码非常简单...我只是根据GeoJSON文件的特征添加路径。
var width = 1000,
    height = 1000;

var svg = d3.select("body")
            .append("svg")
            .attr("width", width + "px")
            .attr("height", height + "px");

var projection = d3.geo.mercator()
    .scale(150)
    .translate([width/2, height/2]);

var path = d3.geo.path()
    .projection(projection);

var g = svg.append("g");

d3.json("geojson/data.geo.json", function(data) {
    console.log(data);
    g.selectAll("path")
        .data(data.features)
        .enter()
        .append("path")
        .attr("d", path)
        .attr("stroke", "black")
        .attr("stroke-width", "5px")
        .attr("fill-opacity", 0);
});

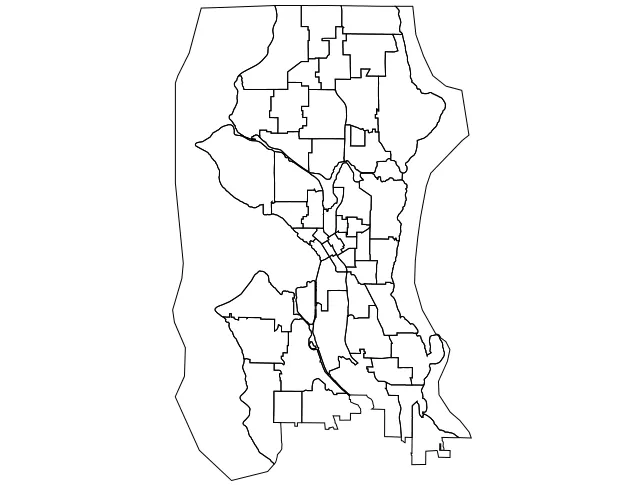
很遗憾,我感觉它只显示了其中一条路径而不是全部路径。起初我以为可能是因为有某种填充,它们只是相互遮盖,但我将fill-opacity设置为0也没有帮助。

这是GeoJSON文件的一个小样本。

{
    "type": "FeatureCollection",
    "features": [
        {
            "type": "Feature",
            "geometry": {
                "type": "Polygon",
                "coordinates": [
                    [
                        [
                            -122.349453,
                            47.717771
                        ],
                        [
                            -122.34948,
                            47.719585
                        ],
                        [
                            -122.349504,
                            47.721403
                        ],
                        [
                            -122.350214,
                            47.721404
                        ],
                        ...
                        [
                            -122.350337,
                            47.721405
                        ],
                        [
                            -122.350258,
                            47.71596
                        ],
                        [
                            -122.349425,
                            47.715958
                        ],
                        [
                            -122.349453,
                            47.717771
                    ]
                ]
            ]
        },
        "properties": {
            "name": "B1",
            "styleUrl": "#PolyStyle00",
            "styleHash": "-59c62042",
            "description": "<html xmlns:fo=\"http://www.w3.org/1999/XSL/Format\" xmlns:msxsl=\"urn:schemas-microsoft-com:xslt\">\n\n<head>\n\n<META http-equiv=\"Content-Type\" content=\"text/html\">\n\n</head>\n\n<body style=\"margin:0px 0px 0px 0px;overflow:auto;background:#FFFFFF;\">\n\n<table style=\"font-family:Arial,Verdana,Times;font-size:12px;text-align:left;width:100;border-collapse:collapse;padding:3px 3px 3px 3px\">\n\n<tr style=\"text-align:center;font-weight:bold;background:#9CBCE2\">\n\n<td>B1</td>\n\n</tr>\n\n<tr>\n\n<td>\n\n<table style=\"font-family:Arial,Verdana,Times;font-size:12px;text-align:left;width:100;border-spacing:0px; padding:3px 3px 3px 3px\">\n\n<tr>\n\n<td>FID</td>\n\n<td>0</td>\n\n</tr>\n\n<tr bgcolor=\"#D4E4F3\">\n\n<td>BEAT</td>\n\n<td>B1</td>\n\n</tr>\n\n<tr>\n\n<td>PRECINCT</td>\n\n<td>N</td>\n\n</tr>\n\n<tr bgcolor=\"#D4E4F3\">\n\n<td>Shape_Leng</td>\n\n<td>53375.265498</td>\n\n</tr>\n\n</table>\n\n</td>\n\n</tr>\n\n</table>\n\n</body>\n\n</html>\n\n"
        }
    },
    ...

最终被绘制的是这样一个东西...

D3 Drawing of GeoJSON File...

任何帮助都将不胜感激。
编辑:很抱歉,看来我从很久以前的学生账户已经消失了。我可以尝试稍后重新创建示例。

您需要适当设置缩放和平移,请参见此处 - Lars Kotthoff
@LarsKotthoff 谢谢你提供的链接。我尝试过调整我的投影中心,但最终仍然得到一个带有边界框的空白svg。在Mike的示例这里中,他通过过滤其他状态来引用单个状态进行居中。我不确定我应该如何指定集合中所有多边形的居中位置 :/ 有什么想法可以解决吗?感谢您的回复! - aug
我所链接的问题的第一个答案集中在整个文件上。 - Lars Kotthoff
我尝试使用这段代码,但仍然无法正常工作。它最终只是绘制了SVG的轮廓和GeoJSON文件的轮廓,没有显示任何节拍区域 :/ 我在这里复制了它(http://students.washington.edu/augbog/datascience/index.html)。 - aug
1个回答

9
我看了一下你的问题。问题似乎出在地图上。我遇到了与您相同的问题,尽管我没有问题从您链接的旧文件(2008年之前)创建地图。Mapshaper (mapshaper.org) 没有问题绘制两个图形,因此问题似乎出现在d3和这个特定的地图上。我没有时间研究原因。
使用Mapshaper简化地图(这也是您可能想要执行的操作)似乎会产生可以正确绘制的地图:
ogr2ogr -f GeoJSON map_tmp.json spd_beats_wgs84.kmz
mapshaper -p 0.5 --repair -o map.json map_tmp.json

我可以使用以下代码绘制地图:
var width = 800;
var height = 500;

var vis = d3.select("#vis").append("svg")
    .attr("width", width).attr("height", height);

d3.json("map.json", function(map) {
  var projection = d3.geo.mercator().scale(1).translate([0,0]).precision(0);
  var path = d3.geo.path().projection(projection);
  var bounds = path.bounds(map);

  var scale = .95 / Math.max((bounds[1][0] - bounds[0][0]) / width,
      (bounds[1][1] - bounds[0][1]) / height);
  var transl = [(width - scale * (bounds[1][0] + bounds[0][0])) / 2,
      (height - scale * (bounds[1][1] + bounds[0][1])) / 2];
  projection.scale(scale).translate(transl);

  vis.selectAll("path").data(map.features).enter().append("path")
    .attr("d", path)
    .style("fill", "none")
    .style("stroke", "black");
});

导致结果:

enter image description here


bounds是一个2x2的数组。如何获得索引[0][3],[1][4]和[0][5]?你需要: var scale = 0.95 / Math.max((bounds[1][0] - bounds[0][0]) / width, (bounds[1][1] - bounds[0][1]) / height); var transl = [(width - scale * (bounds[1][0] + bounds[0][0])) / 2, (height - scale * (bounds[1][1] + bounds[0][1])) / 2]; - Ashwin Balamohan
1
@AshwinBalamohan:你说得对。很奇怪。我已经纠正了。感谢你的反馈。 - Jan van der Laan
@JanvanderLaan 谢谢你的解决方案。它很有帮助。我看到你更新了transl变量赋值,但是scale变量仍然具有大于1的数组索引。 - Ashwin Balamohan
1
@AshwinBalamohan,现在这个问题也已经解决了。 - Jan van der Laan
1
是的,因此简化路径以某种方式使文件能够成功地在d3中呈现地图。 - Waleed93
显示剩余2条评论

网页内容由stack overflow 提供, 点击上面的
可以查看英文原文,
原文链接