在ggplot2中更改标记的粗细

7

我正在使用以下代码将地图与外部特征(Total)的比例点制作出来,但我想改变标记的宽度。

p <- ggplot()
p <- p + geom_polygon( data=all_states, aes(x=LONG*-1, y=LAT, group = ID),colour="black",              fill="white" )
p <- p + geom_point( data=mydata, aes(x=long*-1, y=lat, size = Total),color="mediumblue",     shape=1) +
scale_size(range = c(1,11), name="Sells Volume")+
labs(title="Reglone SL")+
xlab(" ")+
ylab(" ")
p

你应该制作一个可重现的示例 - agstudy
我同意agstudy的观点。请再多描述一些你的意思...你是指geom_point产生的标记吗?你已经通过变量Total对它们进行了缩放,所以你想让它们全部变大吗?你想让它们的大小变化更多吗? - Justin
1个回答

18

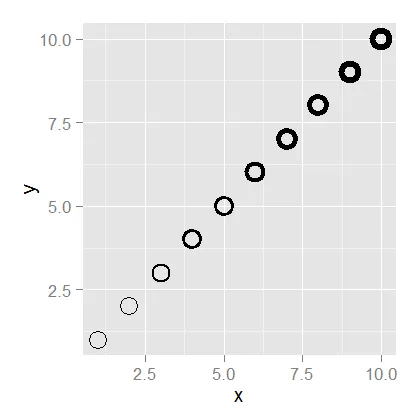
您想要更改空心点边界的厚度吗?您可以使用grid包中的grid.edit完成此操作。

library(ggplot2)
library(grid)

ggplot(data = data.frame(x = 1:10, y = 1:10), aes(x=x, y=y)) + 
   geom_point(size = 10, shape = 1)

grid.force()  # To make the grobs visible to grid editing tools

grid.edit("geom_point.points", grep = TRUE, gp = gpar(lwd = seq(1, 5.5, .5)))

在这里输入图片描述

编辑 使图例标识与数据点匹配

library(ggplot2)
library(grid)
library(gtable)

p = ggplot(data = data.frame(x = 1:10, y = 1:10, c = c(rep("a", 5), rep("b", 5))), 
   aes(x=x, y=y, colour = c)) + 
   geom_point(shape = 1, size = 10)

lwd = 8   # Set line width

g = ggplotGrob(p); dev.off()  # Get the plot grob

# Get the indices for the legend: t = top, r = right, ...
indices <- c(subset(g$layout, name == "guide-box", select = t:r))

# Get the row number of the legend in the layout
rn <- which(g$layout$name == "guide-box")

# Extract the legend
legend <- g$grobs[[rn]]

# Get the legend keys
pointGrobs = which(grepl("points", legend$grobs[[1]]$grobs))

# Check them out - no line width set
# for (i in pointGrobs) str(legend$grobs[[1]]$grobs[[i]])

# Set line width
for (i in pointGrobs) legend$grobs[[1]]$grobs[[i]]$gp$lwd = lwd

# Check them out - line width set
# for (i in pointGrobs) str(legend$grobs[[1]]$grobs[[i]])

# Put the modified legend back into the plot grob
g = gtable_add_grob(g, legend, t=indices$t, l=indices$l)

# g$grobs[[4]]$children[[2]]$gp$lwd = lwd  # Alternative for setting lwd for points in the plot

grid.newpage()
grid.draw(g)

grid.force()  # To make the grobs visible to grid editing tools

grid.edit("geom_point.points", grep = TRUE, gp = gpar(lwd = lwd))

3
在ggplot2中的另一种选择是重叠两个图层:一个是直径逐渐增大、填充点的图层,另一个在上面,是填充为灰色且点更小的图层。 - baptiste
这只改变了点的粗细,而没有改变图例中的大小。我该如何增加后者以匹配前者? - wdkrnls
1
@wdkrnls,抱歉耽搁了。我能做的最好的就是深入研究情节grob结构,将图例键改为与点匹配。请参见编辑。 - Sandy Muspratt

网页内容由stack overflow 提供, 点击上面的
可以查看英文原文,
原文链接