我正在尝试使用OpenCV中的cv2.drawContours函数显示填充轮廓。我已经从使用Canny检测导出的边缘图像中开发了一系列轮廓,并启用RETR_EXTERNAL来定义层次结构。然而,我遇到的问题是,尽管在cv2.drawContours命令中使用-1标志表示填充轮廓,但只显示轮廓本身(即边缘)。例如:
mask = np.zeros(rawimg.shape, np.uint8)
cv2.drawContours(mask, contours[246], -1, (0,255,255), -1)
仅显示轮廓246的外形。由于我只检索外部轮廓,我认为我没有看到每个边缘处找到的内部和外部轮廓之间的差异,所以我有点困惑,不知道为什么它会显示轮廓,但不像-1标志建议的那样填充。
编辑:
完整代码如下所示。问题出在以下行:
cv2.drawContours(mask, cnt, 2, (0,255,255), -1)
尽管这是按照Dan建议的方式格式化的,但结果是以下图像: 。cnt是单个轮廓,因此这是有道理的,它将参考轮廓中的一个点。当该行更改为:
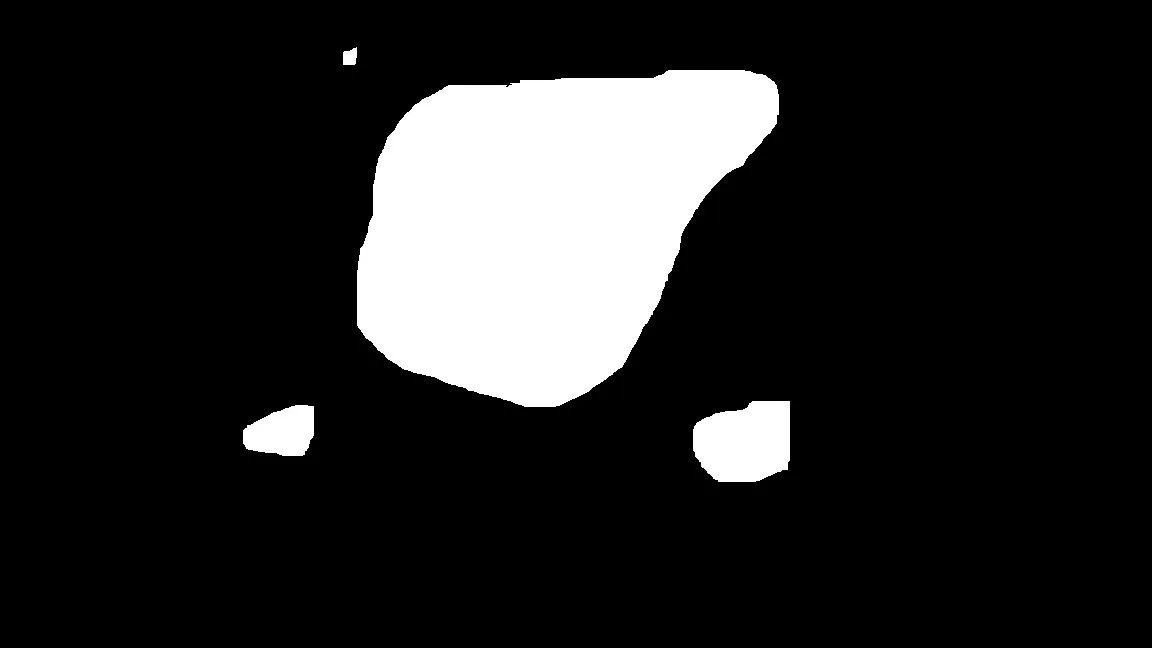
cv2.drawContours(mask, cnt, -1, (0,255,255), -1)
轮廓和之前一样,但是轮廓仍未填充,尽管命令末尾的-1标志表明它应该被填充。
测试图片:
import os
import cv2
import numpy as np
from matplotlib import pyplot as plt
import copy as cp

path = 'C:\\Users\\...deleted...\\Desktop\\testimage6.jpg'


#Determine largest contour in the image
def maxContour(contours):
    cnt_list = np.zeros(len(contours))
    for i in range(0,len(contours)):
        cnt_list[i] = cv2.contourArea(contours[i])

    max_value = np.amax(cnt_list)
    max_index = np.argmax(cnt_list)
    cnt = contours[max_index]

    return cnt, max_index


if os.path.isfile(path):
    # Import the raw image to a working location and save to an isolated     variable
    # Import the raw image to a working location and save to an isolated     variable
    img = cv2.imread(path)
    rawimg = cv2.imread(path)
    saveimg = cv2.imread(path)
    imgray = cv2.cvtColor(saveimg, cv2.COLOR_BGR2GRAY)
    saveimgray = cp.copy(imgray)

    f1 = plt.figure(1)
    f1.set_size_inches(8,10)
    plt.title('Original Image')
    plt.xticks([]), plt.yticks([])
    plt.imshow(rawimg, cmap='gray')
    plt.savefig('output1.jpg', dpi=300)
    cv2.imshow('Raw Image',rawimg)
    cv2.waitKey(0)
    cv2.destroyWindow('Raw Image')

    # Impose an opening function as a filter
    kernel = np.ones((3,3),np.uint8)
    opening = cv2.morphologyEx(img, cv2.MORPH_OPEN, kernel)

    f2 = plt.figure(2)
    f1.set_size_inches(8,10)
    plt.title('Opened Image')
    plt.xticks([]), plt.yticks([])
    plt.imshow(opening, cmap='gray')
    plt.savefig('output2.jpg', dpi=300)
    cv2.imshow('Opened Image', opening)
    cv2.waitKey(0)
    cv2.destroyWindow('Opened Image')


    #Extract the edges from the filtered image
    edges = cv2.Canny(opening,10,100)
    cv2.imshow('Edges', edges)
    cv2.waitKey(0)
    cv2.destroyWindow('Edges')
    f3=plt.figure(3)
    f3.set_size_inches(16,8)
    plt.title('Edge Image')
    plt.xticks([]), plt.yticks([])
    plt.imshow(edges, cmap='gray')
    plt.savefig('output3.jpg', dpi=300)


    #Detect contours in the edge image
    image, contours, hierarchy = cv2.findContours(edges, cv2.RETR_EXTERNAL, cv2.CHAIN_APPROX_NONE)
    cv2.drawContours(img, contours, -1, (0,255,255), 2)
    cv2.imshow('Contours Image', img)
    cv2.waitKey(0)
    cv2.destroyWindow('Contours Image')
    f4=plt.figure(4)
    f4.set_size_inches(16,8)
    plt.title('Contour Image')
    plt.xticks([]), plt.yticks([])
    plt.imshow(img)
    plt.savefig('output2.jpg', dpi=300)

    #Find maximum area contour
    cnt, max_index = maxContour(contours)
    print(max_index)


    # Calculate contour-based statistics
    # TBD


    #Test of removing max contour
    #grayimg = cv2.cvtColor(rawimg, cv2.COLOR_BGR2GRAY)
    mask = np.zeros(rawimg.shape, np.uint8)
    cv2.drawContours(mask, cnt, 2, (0,255,255), -1)
    #ret, mask = cv2.threshold(grayimg, 10, 255, cv2.THRESH_BINARY)
    mask_inv = cv2.bitwise_not(mask)
    cv2.imshow('Mask Image', mask)
    cv2.waitKey(0)
    cv2.destroyWindow('Mask Image')
    cv2.imshow('Mask Image', mask_inv)
    cv2.waitKey(0)
    cv2.destroyWindow('Mask Image')

    #Fit ellipse to contour and calculate ellipse statistics
    (x,y), (w,h), angle = cv2.fitEllipse(cnt)
    rect = cv2.minAreaRect(cnt)
    box = cv2.boxPoints(rect)
    box = np.int0(box)
    x = np.int0(x)
    y = np.int0(y)
    w = np.int0(0.5*w)
    h = np.int0(0.5*h)


    #output2 = cv2.ellipse(img, center, dim, angle, 0, 360, (255,0,0), 12)
    output2 = cv2.ellipse(img, (x,y), (w,h), angle, 0, 360, (255,0,0), 2)
    output3 = cv2.drawContours(output2, [box], 0, (0,255,0), 2)
    cv2.imshow('Ellipse Image',output2)
    cv2.waitKey(0)
    cv2.destroyWindow('Ellipse Image')


else:
    print('file does not exist')`
cv2.drawContours(mask, contours, 246, (0,255,255), -1)。第二个参数应该是一个轮廓的列表,其中每个轮廓都是一个点列表。你现在的方法是将每个点都视为单独的轮廓。我有一种感觉,我已经为相同的问题写过答案了,让我看看能否找到它... - Dan Mašekcv2.drawContours(mask, cnt, 2, (0,255,255), -1)。 - The man they call Jaynecv2.drawContours时,您将其提供给了contours,它是轮廓列表。在第二次调用中,您将其提供给了cnt,它是(来自您的maxContour函数)contours[max_index]--即一个轮廓,而不是包含1个轮廓的列表。您已经有了要绘制的轮廓的索引,因此只需执行cv2.drawContours(mask, contours, max_index, (0,255,255), -1)即可。 - Dan Mašek