如何指定时间定位器的起始时间戳。

9
我想要的非常简单,我只是希望定位器刻度从指定的时间戳开始:
伪代码:locator.set_start_ticking_at( datetime_dummy )
到目前为止,我还没有找到任何东西。
这是与此问题相关的代码部分:
    axes[0].set_xlim(datetime_dummy) # datetime_dummy = '2015-12-25 05:34:00'
    import matplotlib.dates as matdates
    seclocator = matdates.SecondLocator(interval=20) 
    minlocator = matdates.MinuteLocator(interval=1) 
    hourlocator = matdates.HourLocator(interval=12)

    seclocator.MAXTICKS  = 40000
    minlocator.MAXTICKS  = 40000
    hourlocator.MAXTICKS  = 40000

    majorFmt = matdates.DateFormatter('%Y-%m-%d, %H:%M:%S')  
    minorFmt = matdates.DateFormatter('%H:%M:%S')  

    axes[0].xaxis.set_major_locator(minlocator)
    axes[0].xaxis.set_major_formatter(majorFmt)
    plt.setp(axes[0].xaxis.get_majorticklabels(), rotation=90 )

    axes[0].xaxis.set_minor_locator(seclocator)
    axes[0].xaxis.set_minor_formatter(minorFmt)
    plt.setp(axes[0].xaxis.get_minorticklabels(), rotation=90 )

    # other codes
    # save fig as a picture
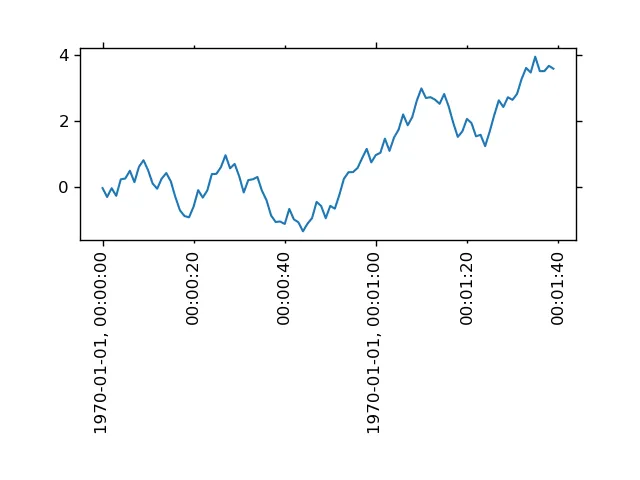
上述代码的x轴刻度将会得到:

enter image description here

我该如何告诉次要定位器与主要定位器对齐?
我该如何告诉定位器从哪个时间戳开始计时?

我尝试过的方法:
set_xlim 无效
seclocator.tick_values(datetime_dummy, datetime_dummy1) 没有任何作用

2个回答

13

使用 bysecondbyminute 来指定需要标记哪些秒和分钟,而非使用 interval 关键字参数。这两个参数用于构建一个 dateutil rrule。该规则生成符合特定模式(或者说“规则”)的日期时间。

例如,bysecond=[20, 40] 限制了日期时间只包含 second 等于 20 或 40 的情况。因此,在下面的示例中,较小的刻度仅在 second 等于 20 或 40 的日期时间上出现。

import numpy as np
import matplotlib.pyplot as plt
import matplotlib.dates as matdates

N = 100

fig, ax = plt.subplots()
x = np.arange(N).astype('<i8').view('M8[s]').tolist()
y = (np.random.random(N)-0.5).cumsum()
ax.plot(x, y)


seclocator = matdates.SecondLocator(bysecond=[20, 40]) 
minlocator = matdates.MinuteLocator(byminute=range(60))  # range(60) is the default

seclocator.MAXTICKS  = 40000
minlocator.MAXTICKS  = 40000

majorFmt = matdates.DateFormatter('%Y-%m-%d, %H:%M:%S')  
minorFmt = matdates.DateFormatter('%H:%M:%S')  

ax.xaxis.set_major_locator(minlocator)
ax.xaxis.set_major_formatter(majorFmt)
plt.setp(ax.xaxis.get_majorticklabels(), rotation=90)

ax.xaxis.set_minor_locator(seclocator)
ax.xaxis.set_minor_formatter(minorFmt)
plt.setp(ax.xaxis.get_minorticklabels(), rotation=90)

plt.subplots_adjust(bottom=0.5)
plt.show()

输入图像描述


1
谢谢!你能否在你的回答中添加更详细的解释,说明 bysecond=list 是如何工作的?我认为我在阅读文档时忽略了这个参数,因为我不理解它的作用。谢谢。 - eliu

2

@unutbu: 非常感谢:我一直在寻找一个相关问题的答案!

@eliu:我已经改编了unutbu的优秀答案,以演示如何定义列表(创建不同的“dateutil”规则),从而完全控制显示哪些x刻度。请依次取消注释下面的每个示例,并调整值以查看效果。希望这可以帮助。

import pandas as pd
import numpy as np
import matplotlib.pyplot as plt
import matplotlib.dates as mdates

idx = pd.date_range('2017-01-01 05:03', '2017-01-01 18:03', freq = 'min')
df = pd.Series(np.random.randn(len(idx)),  index = idx)
fig, ax = plt.subplots()

# Choose which major hour ticks are displayed by creating a 'dateutil' rule e.g.:

# Only use the hours in an explicit list:
# hourlocator = mdates.HourLocator(byhour=[6,12,8])

# Use the hours in a range defined by: Start, Stop, Step:
# hourlocator = mdates.HourLocator(byhour=range(8,15,2))

# Use every 3rd hour:
# hourlocator = mdates.HourLocator(interval = 3)

# Set the format of the major x-ticks:
majorFmt = mdates.DateFormatter('%H:%M')  

ax.xaxis.set_major_locator(hourlocator)
ax.xaxis.set_major_formatter(majorFmt)

#... and ditto to set minor_locators and minor_formatters for minor x-ticks if needed as well)

ax.plot(df.index, df.values, color = 'black', linewidth = 0.4)

fig.autofmt_xdate() # optional: makes 30 deg tilt on tick labels

plt.show()

网页内容由stack overflow 提供, 点击上面的
可以查看英文原文,
原文链接