我发现在 R 中创建美观的三维表面比较具有挑战性。我熟悉这些解决方案(persp, image, wireframe, lattice, rgl 以及其他一些在 Stack Overflow 中的问题中提到的解决方案),但结果并不理想。
是否可能在 R 中创建类似 MATLAB 中的三维表面图?
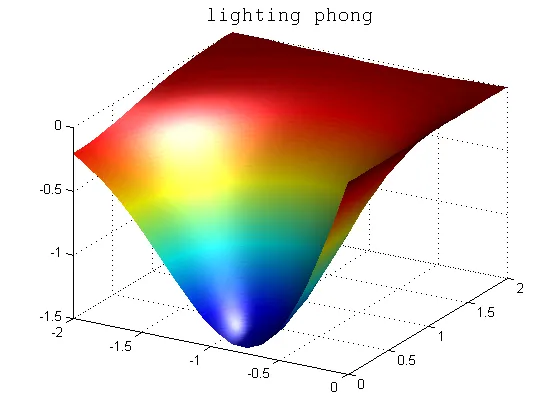
Here is the MATLAB code
    % Create a grid of x and y points
    points = linspace(-2, 0, 20);
    [X, Y] = meshgrid(points, -points);

    % Define the function Z = f(X,Y)
    Z = 2./exp((X-.5).^2+Y.^2)-2./exp((X+.5).^2+Y.^2);

    % "phong" lighting is good for curved, interpolated surfaces. "gouraud"
    % is also good for curved surfaces
    surf(X, Y, Z); view(30, 30);
    shading interp;
    light;
    lighting phong;
    title('lighting phong', 'FontName', 'Courier', 'FontSize', 14);
这个情节现代、色彩鲜艳、美观大方,代码语法非常易读。
在基础R中是否可能实现这一点?
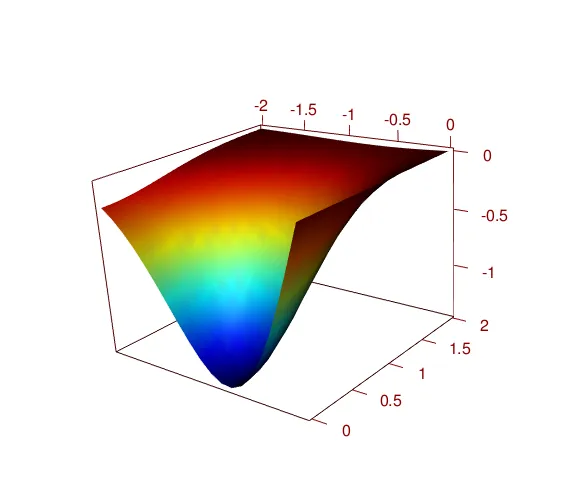
library(emdbook); library(rgl)很有用;curve3d(2/exp((-.5)^2+y^2)-2/exp((x+.5)^2+y^2),sys3d="rgl", xlim=c(0,2),ylim=c(-2,0))是一个开始,虽然它没有颜色。(你需要使用基础R解决方案的特定原因吗?)如果你“熟悉解决方案”,为什么不展示一个起点并告诉我们哪里不“好”呢? - Ben Bolker