由于其他答案需要用户手动调整一些参数进行迭代过程,因此我想添加自己的答案。它是自动的,但是当前实现仅在所有节点大小相等时有效。
节点大小以点为单位,因此它们不随图像缩放而变化。虽然此答案在程序上可以工作,但如果您交互式更改图形的窗口大小,则无法正常工作。`fix_graph_scale` 函数的前半部分计算节点半径,以便根据未来的 x 和 y 缩放比例确定。后半部分设置轴刻度,使其包括所有节点位置加上节点大小的一半。
`get_ax_size` 函数来自
unutbu's answer,稍作修改。
import matplotlib.pyplot as plt
import networkx as nx

def get_ax_size(ax):
    bbox = ax.get_window_extent().transformed(ax.figure.dpi_scale_trans.inverted())
    width, height = bbox.width, bbox.height
    width *= 72
    height *= 72
    return width, height

def fix_graph_scale(ax,pos,node_size = 300):

    node_radius = (node_size / 3.14159265359)**0.5

    min_x = min(i_pos[0] for i_pos in pos.values())
    max_x = max(i_pos[0] for i_pos in pos.values())
    min_y = min(i_pos[1] for i_pos in pos.values())
    max_y = max(i_pos[1] for i_pos in pos.values())

    ax_size_x, ax_size_y = get_ax_size(ax)
    points_to_x_axis = (max_x - min_x)/(ax_size_x-node_radius*2)
    points_to_y_axis = (max_y - min_y)/(ax_size_y-node_radius*2)
    node_radius_in_x_axis = node_radius * points_to_x_axis
    node_radius_in_y_axis = node_radius * points_to_y_axis

    ax_min_x = min_x - node_radius_in_x_axis
    ax_max_x = max_x + node_radius_in_x_axis
    ax_min_y = min_y - node_radius_in_y_axis
    ax_max_y = max_y + node_radius_in_y_axis

    ax.set_xlim([ax_min_x, ax_max_x])
    ax.set_ylim([ax_min_y, ax_max_y])

fig, (ax1, ax2) = plt.subplots(2, 1)
ax1.scatter(range(10), range(10))

G = nx.erdos_renyi_graph(20, p=0.1)
pos = nx.drawing.spring_layout(G)
nx.draw_networkx(G,pos,ax=ax2)

default_node_size = 300
fix_graph_scale(ax2,pos,node_size = default_node_size)
plt.show()
样例结果
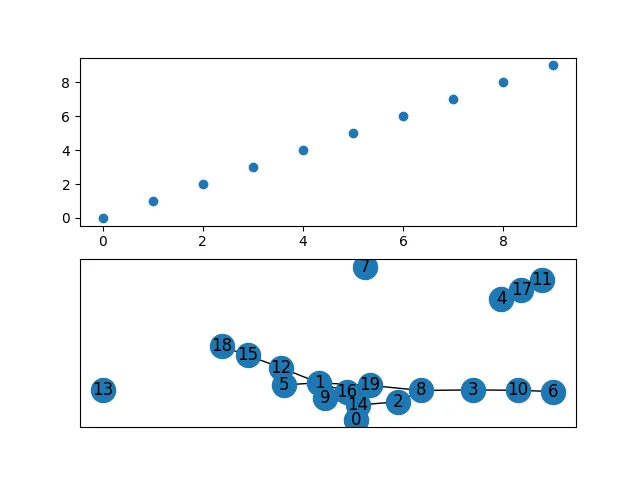
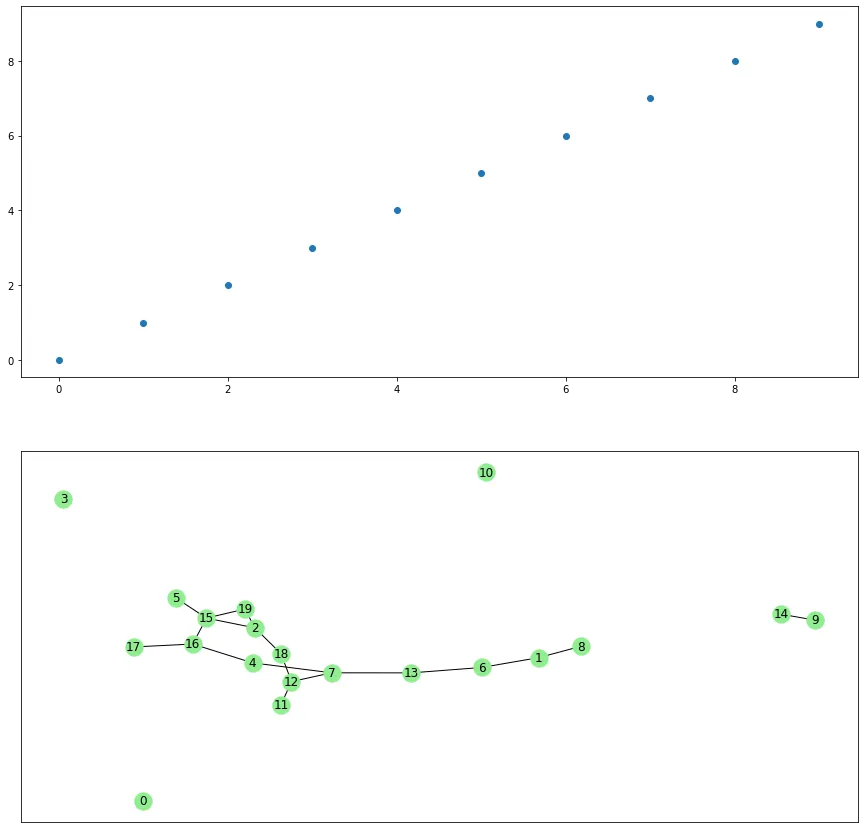
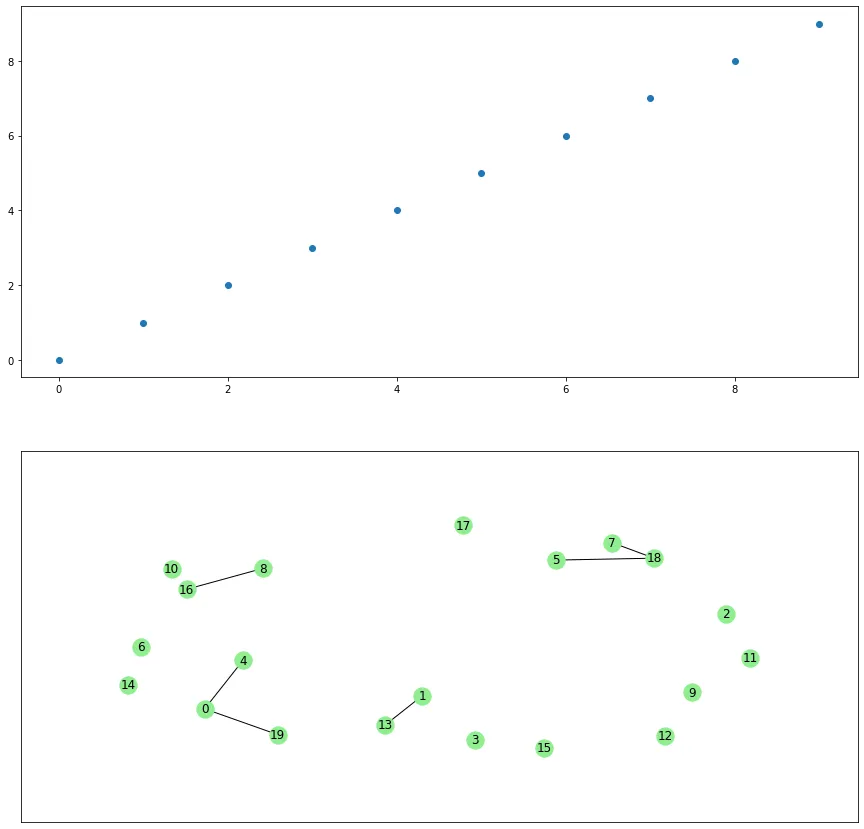
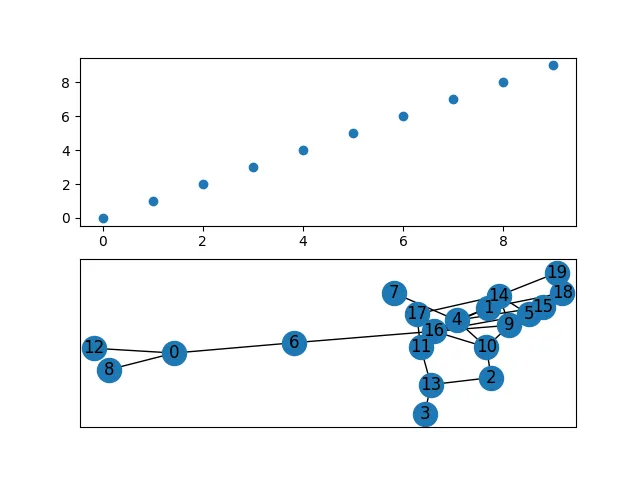
networkx和matplotlib?我在 2.2 版本的networkx和 3.0.2 版本的matplotlib上尝试了你的代码,但无论如何都无法复现你的图形。同样的情况也出现在 networkx 2.4 和 matplotlib 3.1.3 上。 - Sparky05