我面临一个问题,需要绘制具有不同颜色和标记的二维数据。我们有两个数组,分别是points(n x 2维)和Label(n x 1维)。我不确定Label数组中独特值的数量,但最大可能为10。我想根据其对应的Label值以不同的颜色和标记绘制points。请问有人能在这方面帮助我吗?
1个回答
10
使用
gscatter函数,它可以通过使用组(在您的情况下是Label)以不同的颜色/标记进行散点图绘制。GSCATTER(X,Y,G,CLR,SYM,SIZ) specifies the colors, markers, and
size to use. CLR is either a string of color specifications or
a three-column matrix of color specifications. SYM is a string
of marker specifications. Type "help plot" for more information.
For example, if SYM='o+x', the first group will be plotted with a
circle, the second with plus, and the third with x. SIZ is a
marker size to use for all plots. By default, the marker is '.'.
所以您可以像'rgcmykwb'这样指定颜色,以使第一组为红色,第二组为绿色等等,或者只需使用[]让Matlab自行排序。
默认情况下,Matlab对每个组使用相同的标记,因此您需要指定要用于每个组的标记。如果您使用'.ox+*sdv^<>ph',则会循环使用Matlab中的所有标记。
n=50;
% make nx2 matrix of random points.
points = random('unif',0,1,n,2);
% make nx1 matrix of random labels from {1,2,...,5}
labels=round(random('unif',1,5,n,1));

% plot. Let Matlab sort out the colours and we will specify markers.
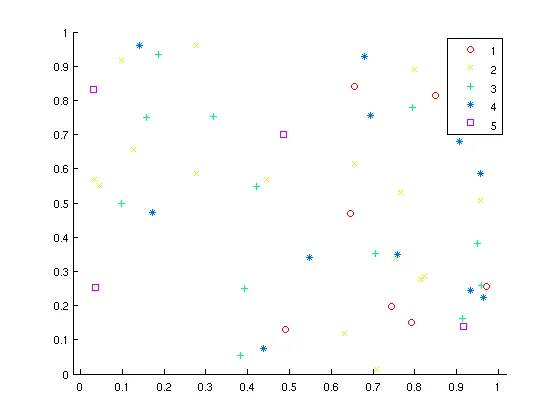
gscatter(points(:,1),points(:,2),labels,[],'ox+*sdv^<>ph.')
看起来有点像这样:
- mathematical.coffee
网页内容由stack overflow 提供, 点击上面的可以查看英文原文,
原文链接
原文链接