我有一个典型的场景,其中有一个向量X和向量Y。向量X包含递增的值,例如X = [1 1 1 2 2 3 4 4 4 4 4]。向量Y包含与X相同大小的实数值。我希望绘制索引Vs Y图,并对相应索引处不同X值的每个值进行颜色变化。
例如,绘图应该为前3个值为1的颜色1,接下来2个值为2的颜色2,1个值为3的颜色3,等等。
请问有人能帮我吗?
例如,绘图应该为前3个值为1的颜色1,接下来2个值为2的颜色2,1个值为3的颜色3,等等。
请问有人能帮我吗?
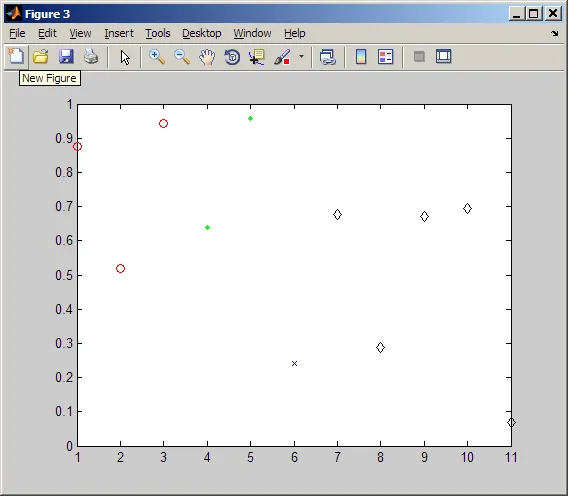
在Laurent的回答的基础上,并且实现了您的“Index vs Y”要求,
建议如下操作:(点击此处查看Laurent的回答)function color_plot(data_vector, color_vector)
styles={'ro','g.','bx','kd'};
hold off;
for i=unique(color_vector)
thisIdx=find(color_vector==i);
thisY=data_vector(color_vector==i);
thisStyle=styles{mod(i-1,numel(styles))+1};
plot(thisIdx,thisY,thisStyle);
hold on;
end
hold off;
thisStyle。X = [1 1 1 2 2 3 4 4 4 4 4];
Y=rand(size(X))
color_plot(Y,X)
现在提供
plot()函数选项可能会更好(也许已经存在)。function colorPlot( data_vector, colors_vector)
%PLOTCOL plots data_vector with colors found in colors_vector
Styles=[{'r-'} {'g-'} {'b-'} {'k-'}];
last_off=0;
last_data=0;
for i=unique(colors_vector)
data_segment=data_vector(colors_vector==i);
len=length(data_segment);
if last_off==0
hold off;
plot( data_segment, 1:len,char(Styles(i)));
last_off=len;
else
plot([last_data data_segment],last_off:last_off+len,char(Styles(i)));
last_off=last_off+len;
end
last_data=data_segment(len);
hold on;
end
hold off;
end
调用方式如下:
colorPlot(Y,X);
a与Y的图形”时,对于你来说,a在y轴上,而Y在x轴上吗?我理解恰好相反... - Jonas Heidelberga vs. Y",实际上是的,我假设 a 是纵坐标,Y 是横坐标。(但我不是母语人士,也许我错了) - Laurent'