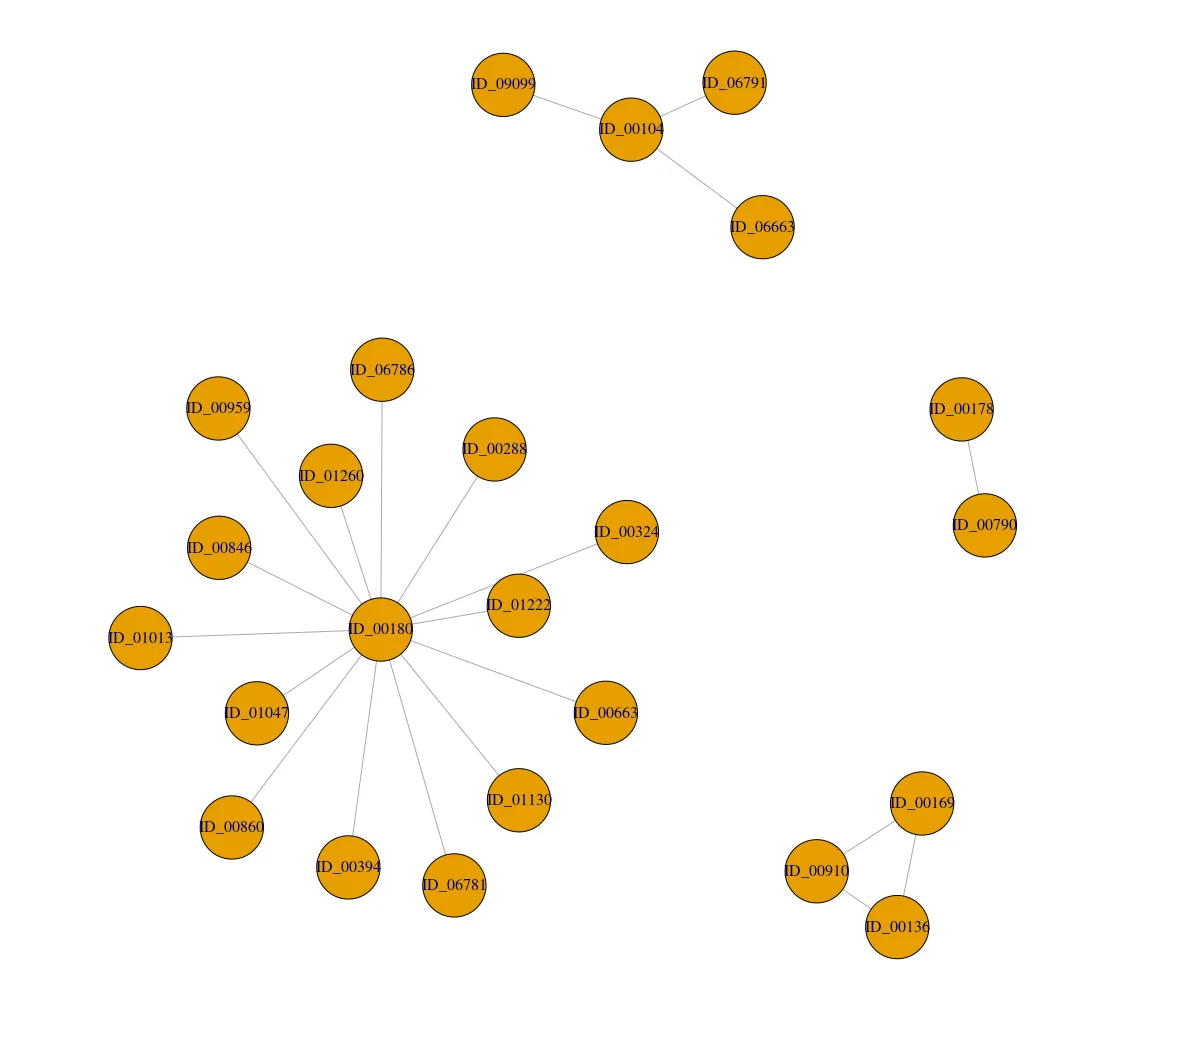
我有一个包含四个不同聚类大小组件的图形。
我可以通过以下代码查看细节:
cl <- components(graph1)
详细信息看起来像这样:
$membership
ID_00104 ID_00136 ID_00169 ID_00178 ID_00180 ID_06663 ID_06791 ID_09099 ID_00910 ID_00790 ID_01013 ID_01130 ID_01260 ID_00394 ID_00860 ID_00959 ID_01222 ID_00288 ID_00324 ID_00663 ID_00846 ID_01047 ID_06781 ID_06786
       1        2        2        3        4        1        1        1        2        3        4        4        4        4        4        4        4        4        4        4        4        4        4        4

$csize
[1]  4  3  2 15

$no
[1] 4
使用以下代码,我还可以获取节点的degree数量。
degree(graph1)
输出结果为
ID_00104 ID_00136 ID_00169 ID_00178 ID_00180 ID_06663 ID_06791 ID_09099 ID_00910 ID_00790 ID_01013 ID_01130 ID_01260 ID_00394 ID_00860 ID_00959 ID_01222 ID_00288 ID_00324 ID_00663 ID_00846 ID_01047 ID_06781 ID_06786
       3        2        2        1       14        1        1        1        2        1        1        1        1        1        1        1        1        1        1        1        1        1        1        1
我可以使用以下代码将所有组件的任意两个节点连接起来(从两个组件中随机选择)(这是我之前一个帖子中的解决方案)。请参考此帖。
graph1 <-  graph_from_data_frame(g, directed = FALSE)
E(graph1)$weight <- g$values
cl <- components(graph1)
graph2 <- with(
  stack(membership(cl)),
  add.edges(
    graph1,
    c(combn(sapply(split(ind, values), sample, size = 1), 2)),
    weight = 0.01))
现在,我想在那些具有最高度数的节点之间添加一个边,例如:
ID_00180的度数为14(附图左侧组件),ID_00104的度数为3(附图顶部组件)。在合并这两个组件时,我想在ID_00180和ID_00104之间添加一条边(而不是随机选择)。如果任何组件具有多个相同数量的最高度数,例如:附图右下角的组件(所有节点的度数均为2),那么我们可以从最高度数的节点中随机选择任何一个。比如说,我们可以在
ID_00180和任何节点之间添加一条边。可重现数据。
g <- structure(list(query = structure(c(1L, 1L, 1L, 2L, 2L, 3L, 4L,
                                        5L, 5L, 5L, 5L, 5L, 5L, 5L, 5L, 5L, 5L, 5L, 5L, 5L, 5L), .Label = c("ID_00104",
                                                                                                            "ID_00136", "ID_00169", "ID_00178", "ID_00180"), class = "factor"),
                    target = structure(c(16L, 19L, 20L, 1L, 9L, 9L, 6L, 11L,
                                         13L, 15L, 4L, 8L, 10L, 14L, 2L, 3L, 5L, 7L, 12L, 17L, 18L
                    ), .Label = c("ID_00169", "ID_00288", "ID_00324", "ID_00394",
                                  "ID_00663", "ID_00790", "ID_00846", "ID_00860", "ID_00910", "ID_00959",
                                  "ID_01013", "ID_01047", "ID_01130", "ID_01222", "ID_01260", "ID_06663",
                                  "ID_06781", "ID_06786", "ID_06791", "ID_09099"), class = "factor"),
                    values = c(0.654172560113154, 0.919096895578551, 0.925821596244131,
                                0.860406091370558, 0.746376811594203, 0.767195767195767,
                                0.830379746835443, 0.661577608142494, 0.707520891364902,
                                0.908193484698914, 0.657118786857624, 0.687664041994751,
                                0.68586387434555, 0.874513618677043, 0.836646499567848, 0.618361836183618,
                                0.684163701067616, 0.914728682170543, 0.876297577854671,
                                0.732707087959009, 0.773116438356164)), row.names = c(NA,
                                                                                      -21L), class = "data.frame")
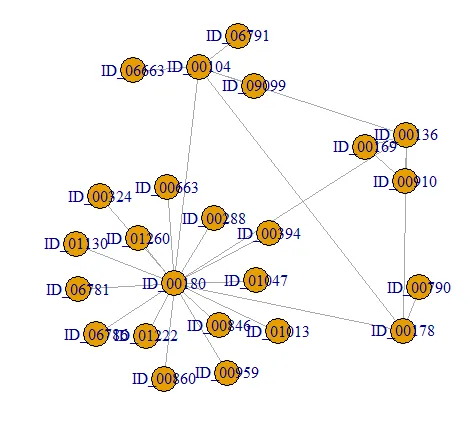
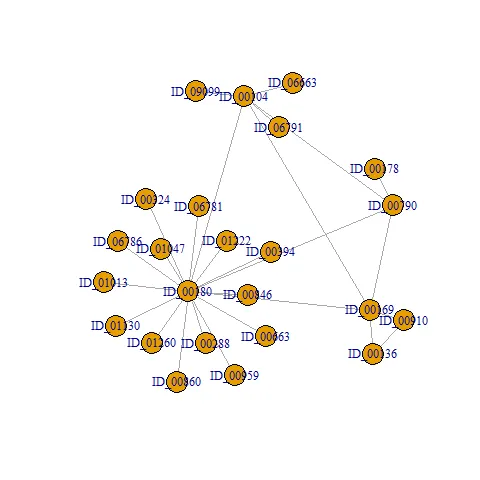
graph2对象包含6个组合。我认为您的代码给出了单独图形的最大节点连接!您介意检查一下代码吗? - 0Knowledge