我有4个组的roc曲线,我想在图例中为每个组添加auc值:
## draw plots
basicplot <- ggplot(roc_long, aes(d = outcome, m = prediction, color = model)) + geom_roc(n.cuts = 0) +
+ style_roc(theme = theme_bw, xlab = "1-Specificity", ylab = "Sensitivity")
## calculate auc
calc_auc(basicplot)
PANEL group AUC
1 1 1 0.7718926
2 1 2 0.9296029
3 1 3 0.7790979
4 1 4 0.8235286
annotate <- basicplot +
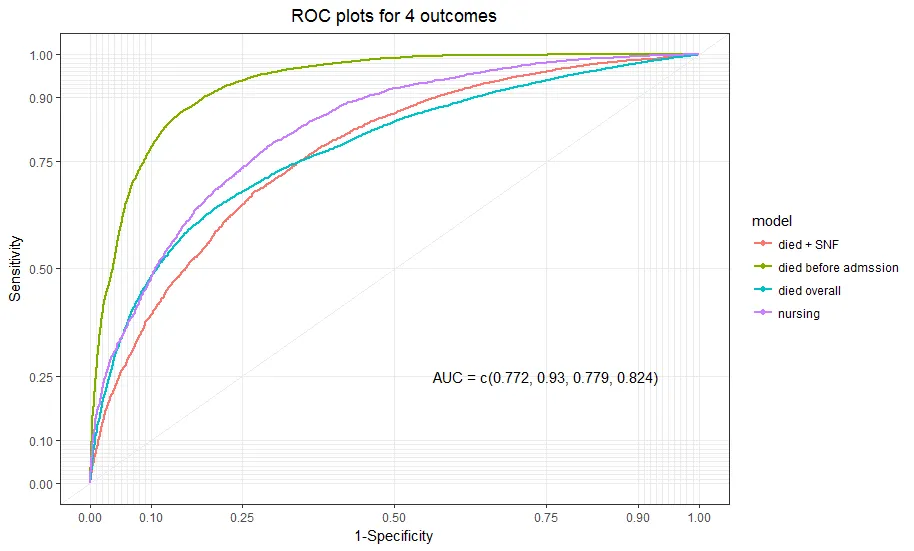
ggtitle("ROC plots for 4 outcomes") +
theme(plot.title = element_text(hjust = 0.5)) +
annotate("text", x = .75, y = .25, label = paste("AUC =", round(calc_auc(basicplot)["AUC"], 3)))
annotate
我的图表看起来像这样:
 如何在右侧的每个组中添加AUC?
谢谢!
calc_auc函数,因此无法重现。 - Axemanscale_color_manual并定义labels和breaks。请查看这里。 - missuse