我今天刚开始尝试使用Matplotlib。我花了几个小时来解决标题和轴标签的位置问题,但都没有成功。我发现可以使用padding参数来解决标题与图表顶部之间以及轴标签和刻度之间的间距问题。但我不知道如何使标题不被挤在图形的顶部,x / y轴标签也不会被挤在图形的左侧/底部。
以下是一个示例,与我的实际问题无关,只是说明格式问题。
import matplotlib.pyplot as plt
import numpy as np
#create data
A = 5
f = 0.5
t = np.arange(0,10,0.01)
y = A * np.sin(2*np.pi*f*t)
#create plot
fig, ax = plt.subplots()
fig.set_size_inches(8*(16/9),8)
ax.plot(t,y)
#format plot
ax.spines.top.set_visible(False)
ax.spines.right.set_visible(False)
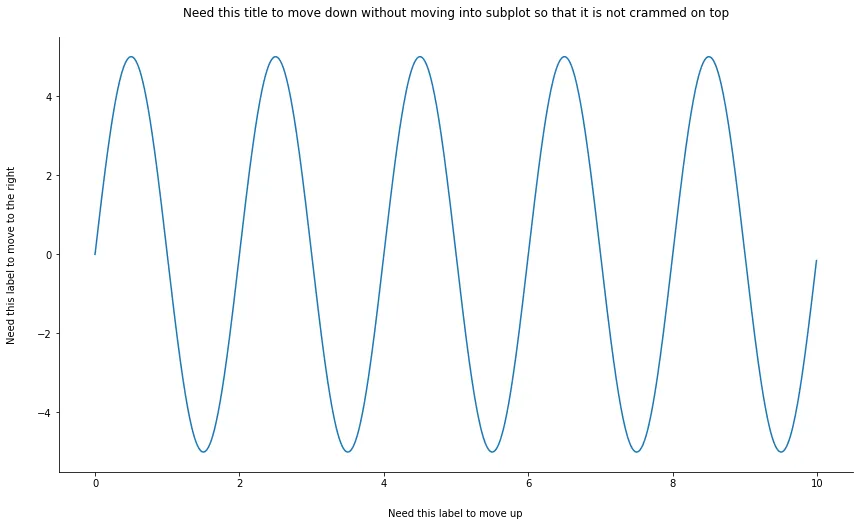
ax.set_title('Need this title to move down without moving into subplot so that it is not crammed on top',pad=20)
ax.set_ylabel('Need this label to move to the right',labelpad=20)
ax.set_xlabel('Need this label to move up',labelpad=20)