在我的一个图表中,我使用了一个次要轴。我的代码创建了两个不同的图例,并在图表中显示了这些图例。以下是我的代码:
我该如何创建一个包含三个标签的图例?以及如何将这个图例显示在我的图表外面?
fig3 = plt.figure()
ax3 = fig3.add_subplot(111)
ax4 = fig3.add_subplot(111)
ax4 = ax3.twinx()
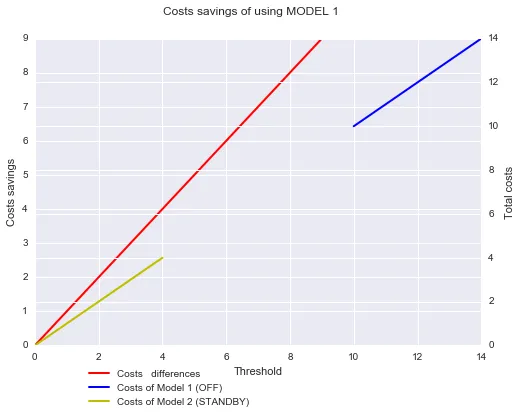
line6 = ax3.plot(threshold, different_costs, '-r', label = 'Costs differences', linewidth = 2.0)
line7 = ax4.plot(threshold, costs1, '-b', label = 'Costs of Model 1 (OFF)', linewidth = 2.0)
line9 = ax4.plot(threshold, costs2, '-y', label = 'Costs of Model 2 (STANDBY)', linewidth = 2.0)
ax3.set_xlabel("Threshold")
ax3.set_ylabel("Costs savings")
ax4.set_ylabel("Total costs")
plt.suptitle("Costs savings of using MODEL 1")
plt.legend()
plt.show()
我该如何创建一个包含三个标签的图例?以及如何将这个图例显示在我的图表外面?
bbox中使用不同的数字来适应所有文本。如果答案解决了你的问题,请不要忘记点赞和接受。 - Chuck