我知道如何使用plt.legend(loc='lower left')设置matplotlib绘图的图例位置,但是我正在使用pandas的方法df.plot()绘图,需要将图例位置设置为“左下角”。
有人知道怎么做吗?
编辑:实际上我正在寻找一种通过pandas的df.plot()方法来实现它的方法,而不是通过plt.legend(loc='lower left')来实现。
我知道如何使用plt.legend(loc='lower left')设置matplotlib绘图的图例位置,但是我正在使用pandas的方法df.plot()绘图,需要将图例位置设置为“左下角”。
有人知道怎么做吗?
编辑:实际上我正在寻找一种通过pandas的df.plot()方法来实现它的方法,而不是通过plt.legend(loc='lower left')来实现。
好的,只需将它链接起来即可。
dframe.rank(ascending=False).plot(kind= 'bar').legend(loc='best')
假设'dframe'是一个DataFrame。
.legend的文档位于https://matplotlib.org/stable/api/_as_gen/matplotlib.pyplot.legend.html。 - phhu为了澄清原回答,目前无法通过 pandas.DataFrame.plot 来实现。在其当前版本(1.2.3)中,plot 的 'legend' 参数仅接受布尔值或字符串 'reverse':
legend: False/True/'reverse'
在轴子图上放置图例
它不接受图例位置字符串。剩余的 **kwargs 被传递到对应于指定 'kind' 参数的底层 matplotlib.pyplot 方法(默认为 matplotlib.pyplot.plot)。这些方法中没有任何一个允许通过其关键字参数来调整图例位置。
因此,目前唯一的方法是直接使用 plt.legend() - 如下面我的原始回答所述。
正如评论中所示,您必须使用 plt.legend(loc='lower left') 将图例放在左下角。即使使用 pandas.DataFrame.plot - 也没有调整图例位置的参数,只有是否绘制图例。下面是一个完整示例,展示了用法。
import pandas as pd
import matplotlib.pyplot as plt
import numpy as np
x = np.linspace(0, 10, 100)
y = np.random.random(100)
df = pd.DataFrame({'x': x, 'y':y})
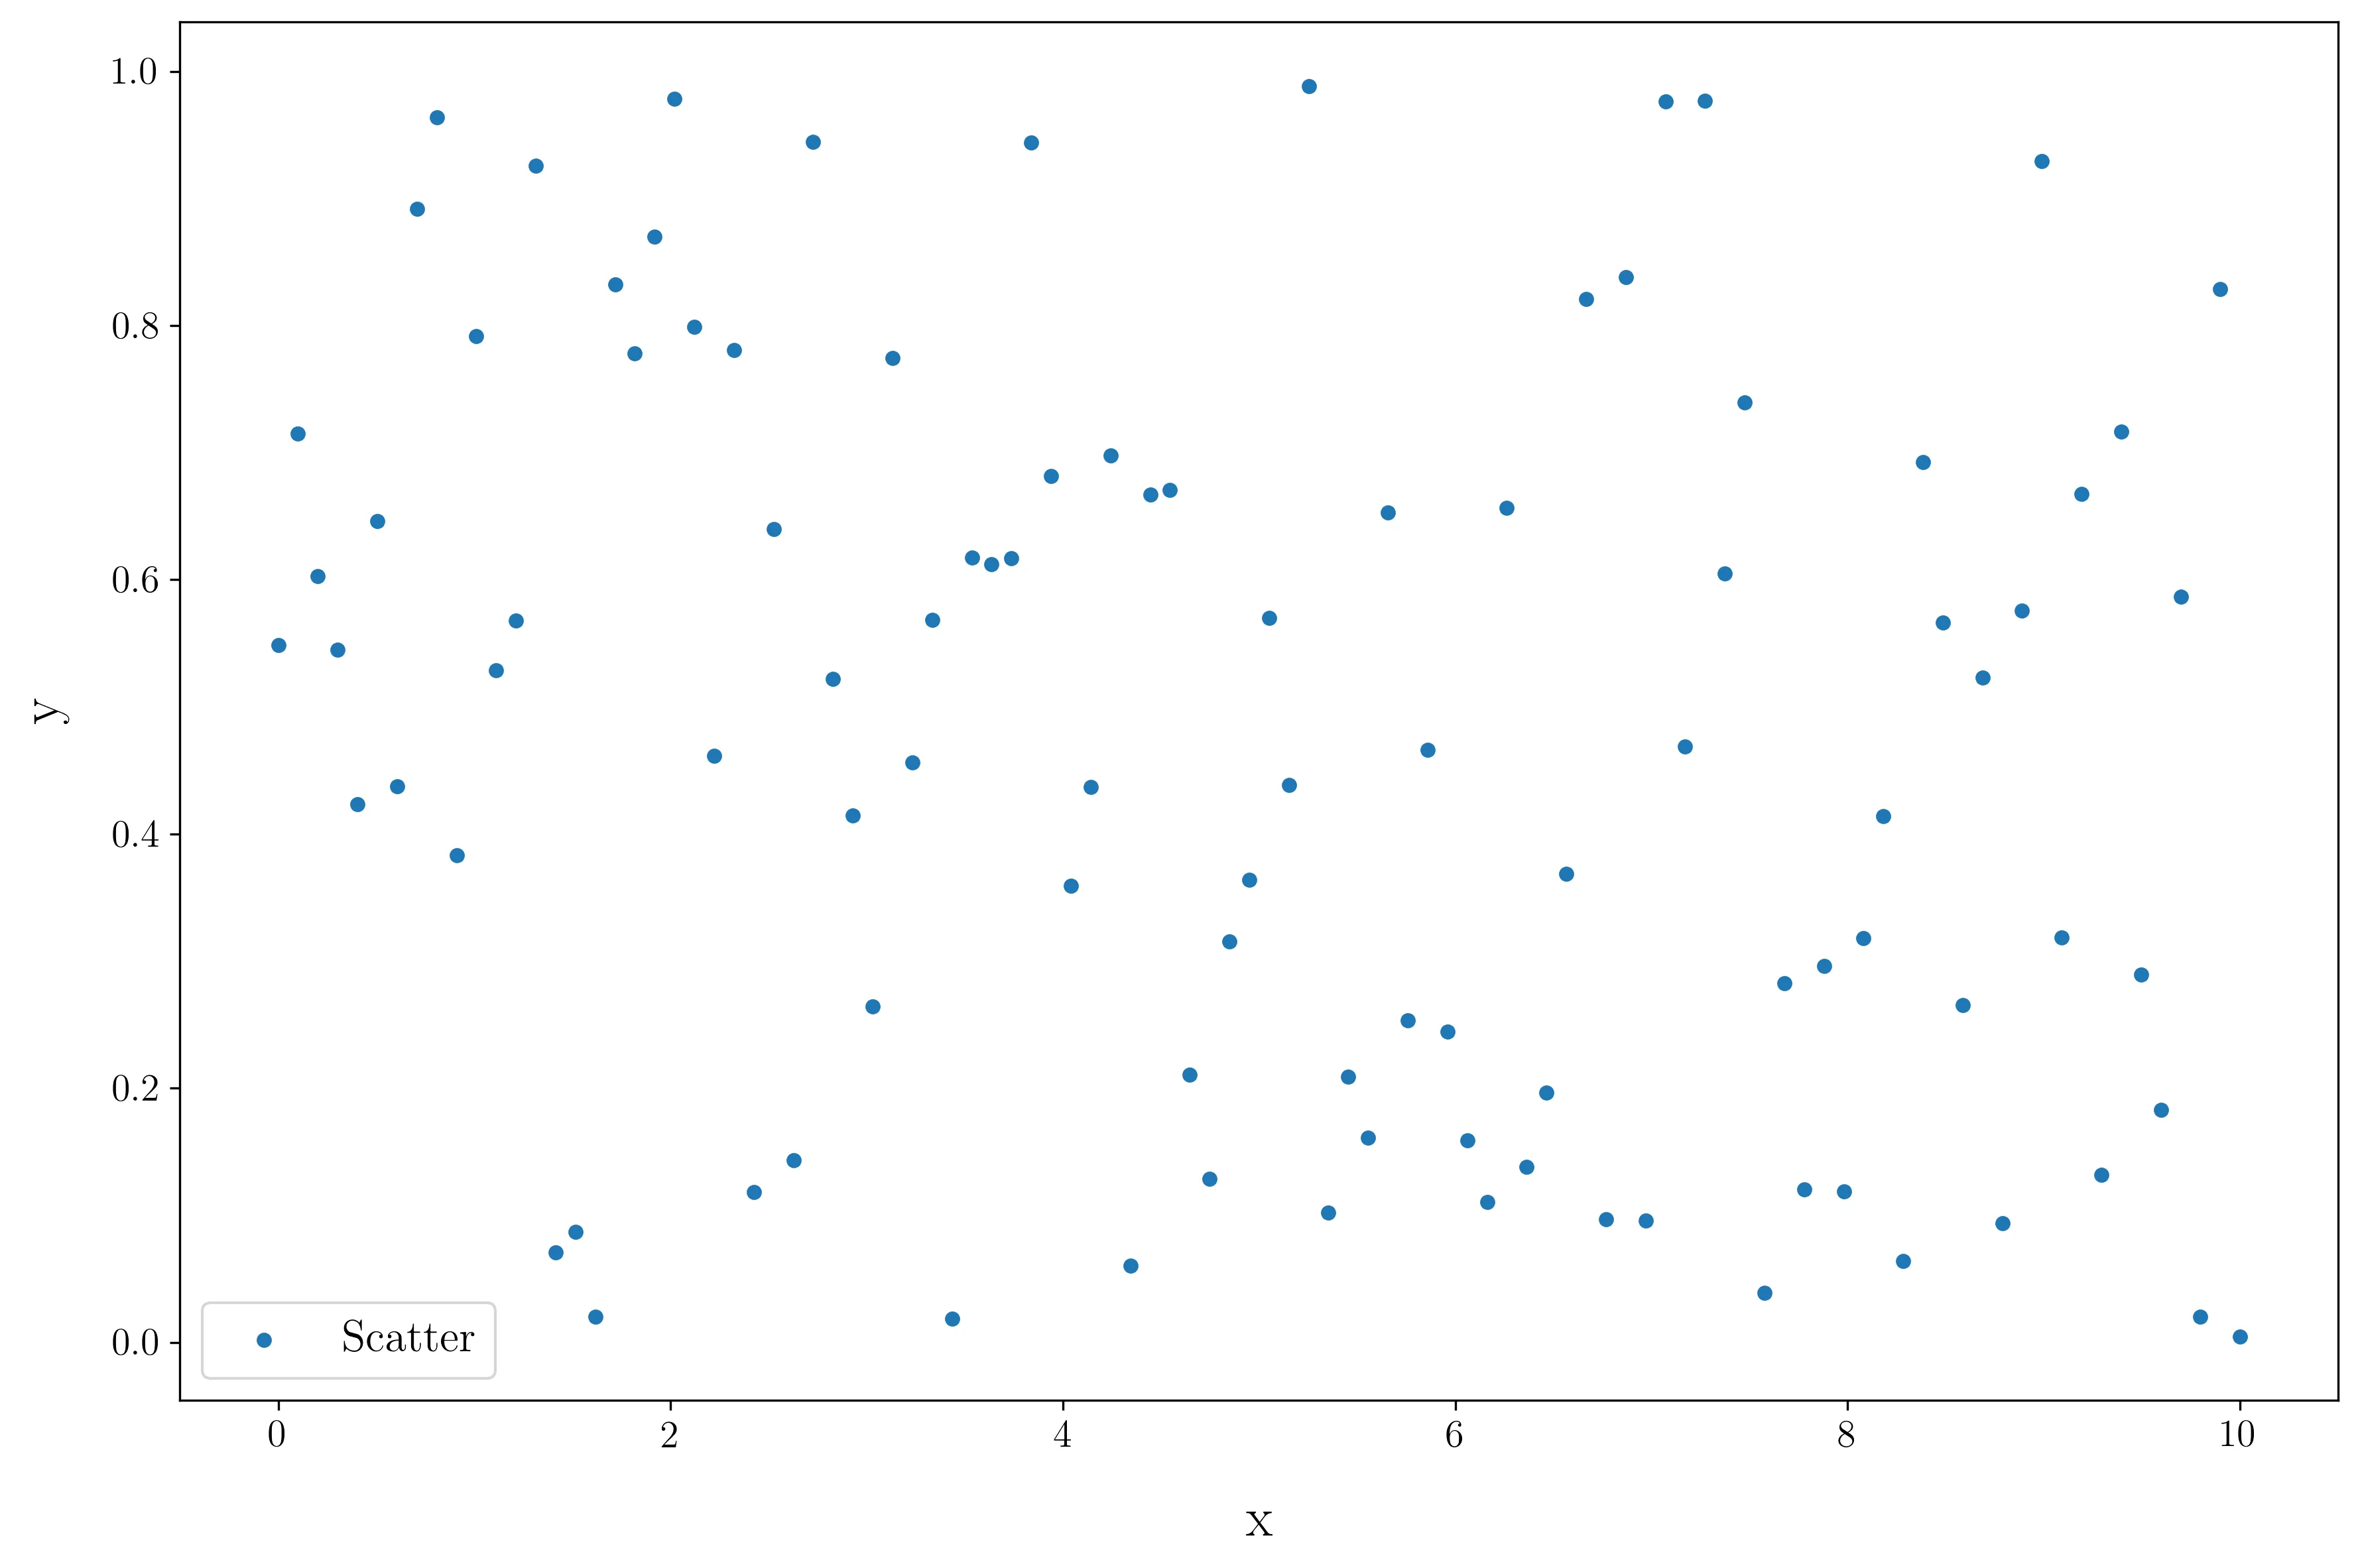
df.plot(kind='scatter', x='x', y='y', label='Scatter')
plt.legend(loc='lower left')
plt.show()
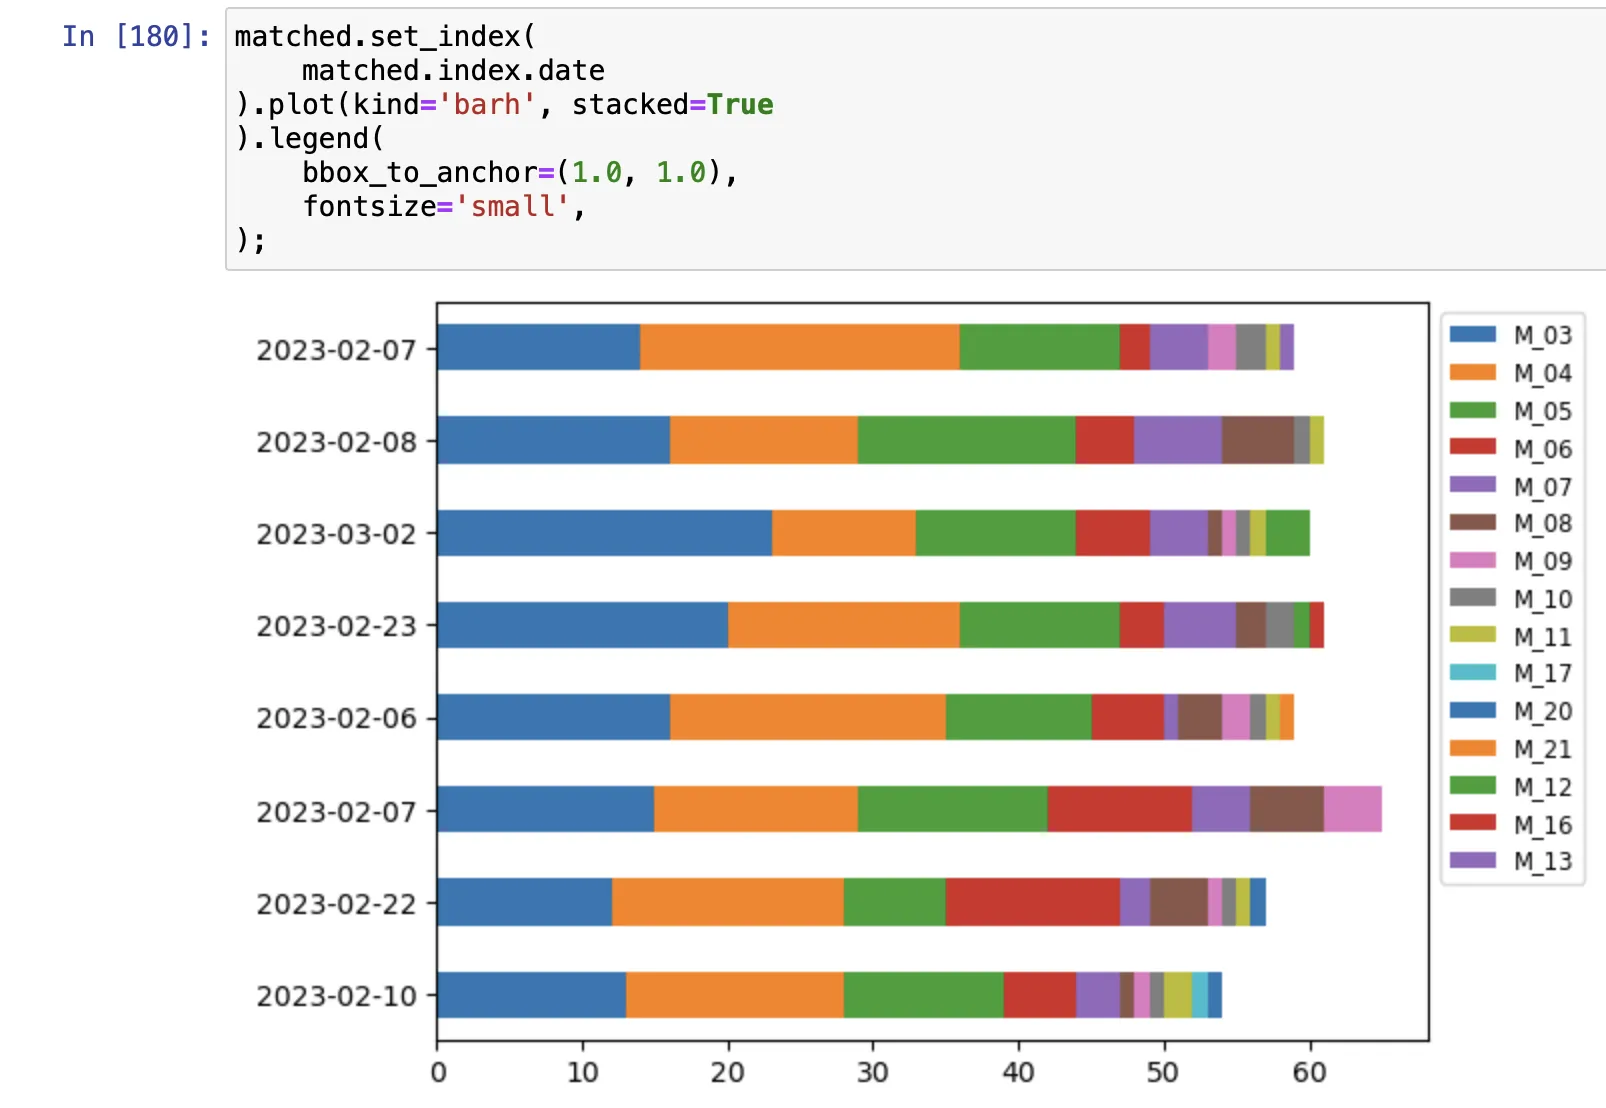
在 pandas 1.5.3 中,您可以在 plot() 后面链接 legend(),请参见 matplotlib。
示例:
matched.set_index(
    matched.index.date
).plot(kind='barh', stacked=True
).legend(
    bbox_to_anchor=(1.0, 1.0),
    fontsize='small',
);
plt.legend(loc='lower left')无效? - ImportanceOfBeingErnest