我正在尝试使用 Bokeh,并混合代码。我从 Pandas DataFrame 创建了下面这个图表,它正确地显示了我想要的所有工具元素。然而,工具提示只显示了部分数据。
以下是该图表:
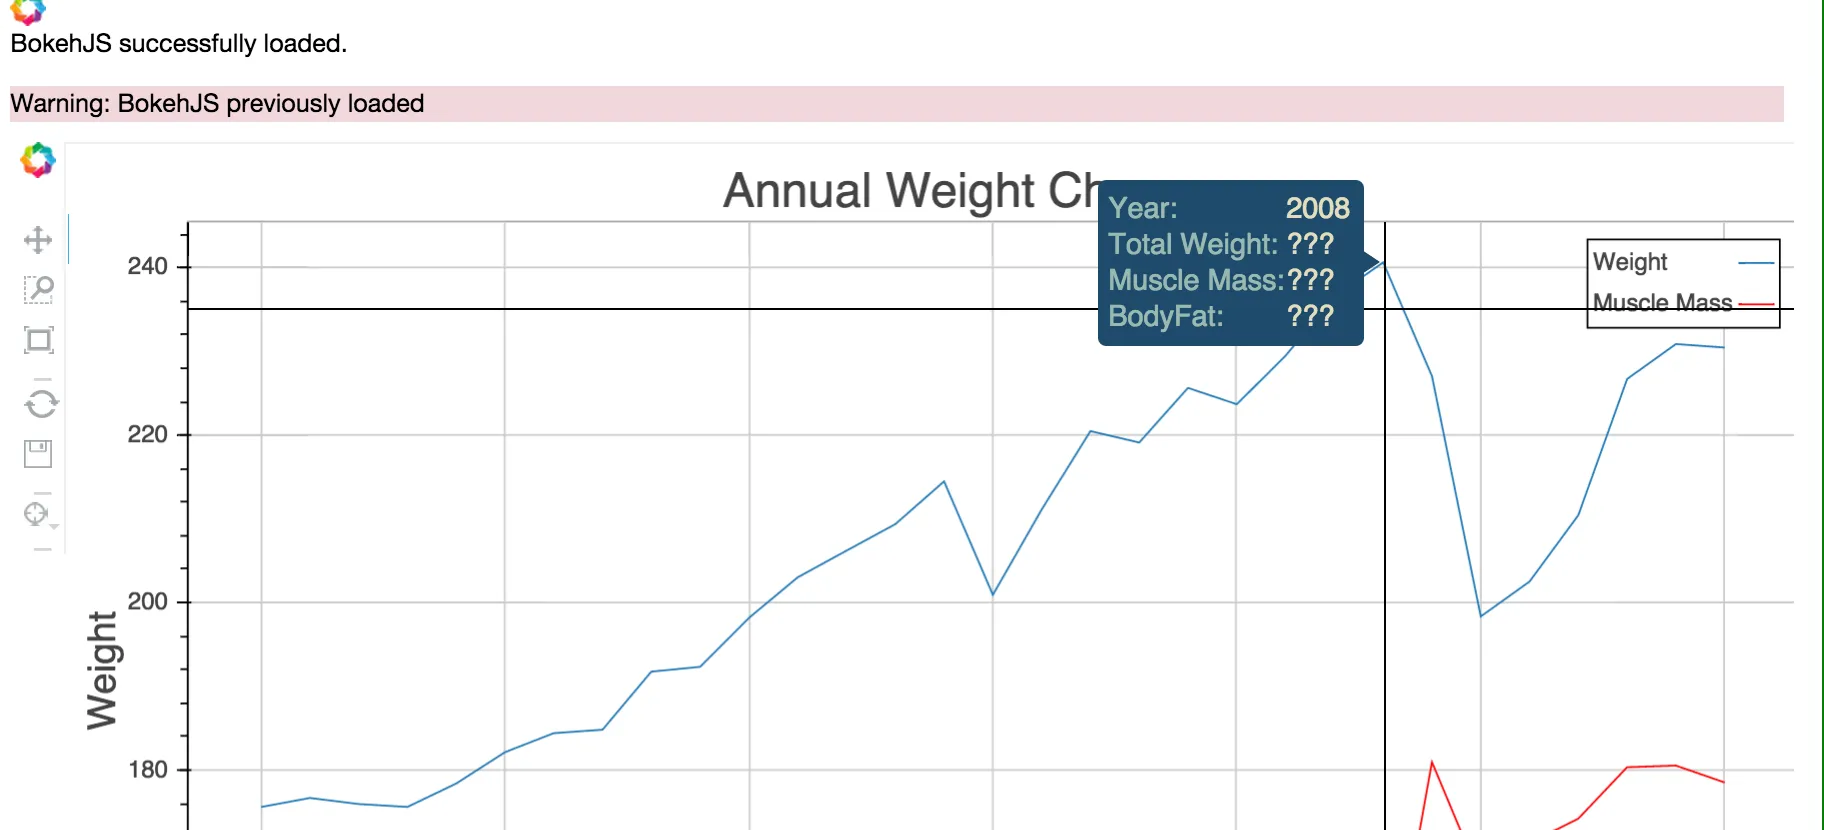
以下是我的代码:
from bokeh.plotting import figure, show
from bokeh.io import output_notebook
from bokeh.models import HoverTool
from collections import OrderedDict

x  = yearly_DF.index
y0 = yearly_DF.weight.values
y1 = yearly_DF.muscle_weight.values
y2 = yearly_DF.bodyfat_p.values

#output_notebook()

p = figure(plot_width=1000, plot_height=600,
           tools="pan,box_zoom,reset,resize,save,crosshair,hover",
           title="Annual Weight Change",
           x_axis_label='Year',
           y_axis_label='Weight',
           toolbar_location="left"
          )

hover = p.select(dict(type=HoverTool))
hover.tooltips = OrderedDict([('Year', '@x'),('Total Weight', '@y0'), ('Muscle Mass', '$y1'), ('BodyFat','$y2')])

output_notebook()

p.line(x, y0, legend="Weight")
p.line(x, y1, legend="Muscle Mass", line_color="red")

show(p)
我已经测试过Firefox 39.0、Chrome 43.0.2357.130(64位)和Safari Version 8.0.7。我已经清除了缓存,在所有浏览器中都遇到了同样的错误。此外,我执行了pip install bokeh --upgrade以确保我正在运行最新版本。