保存Matplotlib中的子图

90
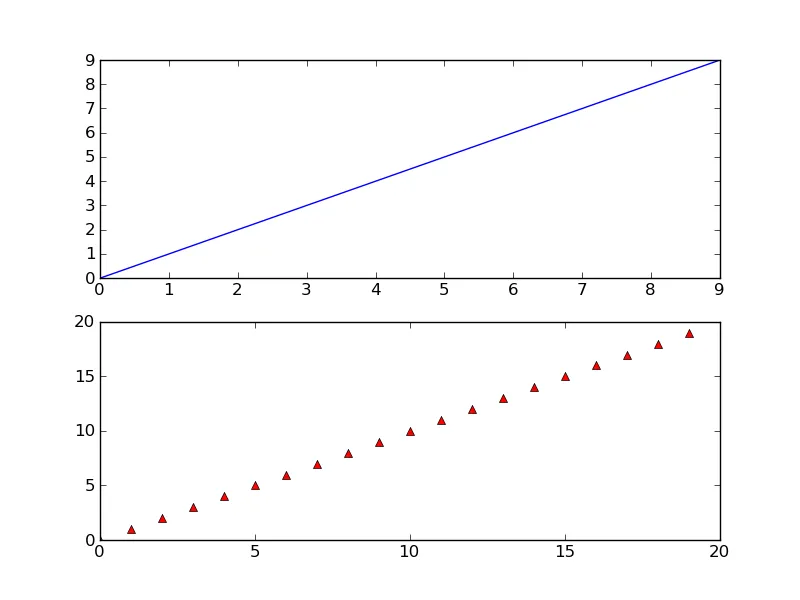
可以将matplotlib图中的单个子图保存为png吗?假设我有一个这样的图:
import pyplot.matplotlib as plt
ax1 = plt.subplot(121)
ax2 = plt.subplot(122)
ax1.plot([1,2,3],[4,5,6])    
ax2.plot([3,4,5],[7,8,9])

可以将两个子图保存到不同的文件中,或者至少将它们分别复制到一个新的图形中以便保存吗?
我正在使用RHEL 5上的matplotlib版本1.0.0。
2个回答

162

虽然 @Eli 的说法是正确的,通常情况下不需要这样做,但是确实可以。 savefig 函数可以使用 bbox_inches 参数来选择性地保存图形的部分到一个图像中。

这里有一个快速的例子:

import matplotlib.pyplot as plt
import matplotlib as mpl
import numpy as np

# Make an example plot with two subplots...
fig = plt.figure()
ax1 = fig.add_subplot(2,1,1)
ax1.plot(range(10), 'b-')

ax2 = fig.add_subplot(2,1,2)
ax2.plot(range(20), 'r^')

# Save the full figure...
fig.savefig('full_figure.png')

# Save just the portion _inside_ the second axis's boundaries
extent = ax2.get_window_extent().transformed(fig.dpi_scale_trans.inverted())
fig.savefig('ax2_figure.png', bbox_inches=extent)

# Pad the saved area by 10% in the x-direction and 20% in the y-direction
fig.savefig('ax2_figure_expanded.png', bbox_inches=extent.expanded(1.1, 1.2))

完整的图形: Full Example Figure


第二个子图内部的区域: Inside second subplot


第二个子图周围在x方向和y方向分别填充了10%和20%的区域: Full second subplot


9
+1:哇!我希望在学习Matplotlib的时候能够接触到这些方法!如果官方文档能够引导读者前往这些有用的Matplotlib角落,并且相关概念的呈现更加结构化,那将会是非常棒的。 :) - Eric O. Lebigot
1
一天不学习新东西是遗憾的一天……干得好++ - Eli Bendersky
1
如果我们使用
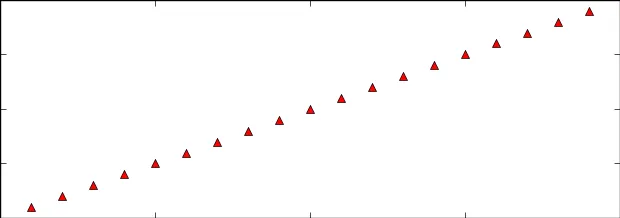
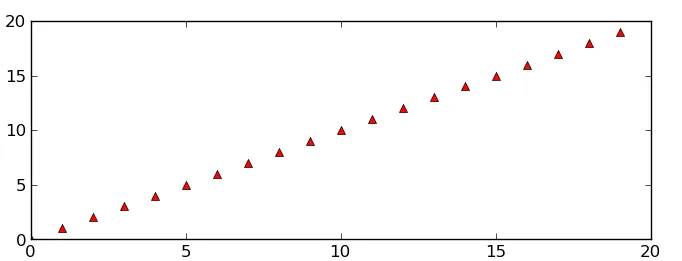
extent.expanded()方法,如何减少所生成图形顶部和右侧的冗余空间?我们能否精确指定所生成图形四个边缘的空间?那将非常好。 - jdhao
神奇。我不知道你是怎么想出来的。 - cerebrou
太棒了!为了隐藏坐标轴线的黑色余留部分,您可以在保存后切换 ax2.axis('off')ax2.axis('on') - F1iX
显示剩余2条评论

52

应用 @Joe 在 3 年后从 这里 给出的 full_extent() 函数,您可以准确地获得 OP 寻找的内容。 或者,您也可以使用 Axes.get_tightbbox() 函数,它可以给出一个稍微更紧凑的边界框。

import matplotlib.pyplot as plt
import matplotlib as mpl
import numpy as np
from matplotlib.transforms import Bbox

def full_extent(ax, pad=0.0):
    """Get the full extent of an axes, including axes labels, tick labels, and
    titles."""
    # For text objects, we need to draw the figure first, otherwise the extents
    # are undefined.
    ax.figure.canvas.draw()
    items = ax.get_xticklabels() + ax.get_yticklabels() 
#    items += [ax, ax.title, ax.xaxis.label, ax.yaxis.label]
    items += [ax, ax.title]
    bbox = Bbox.union([item.get_window_extent() for item in items])

    return bbox.expanded(1.0 + pad, 1.0 + pad)

# Make an example plot with two subplots...
fig = plt.figure()
ax1 = fig.add_subplot(2,1,1)
ax1.plot(range(10), 'b-')

ax2 = fig.add_subplot(2,1,2)
ax2.plot(range(20), 'r^')

# Save the full figure...
fig.savefig('full_figure.png')

# Save just the portion _inside_ the second axis's boundaries
extent = full_extent(ax2).transformed(fig.dpi_scale_trans.inverted())
# Alternatively,
# extent = ax.get_tightbbox(fig.canvas.renderer).transformed(fig.dpi_scale_trans.inverted())
fig.savefig('ax2_figure.png', bbox_inches=extent)

我想发一张图片,但我缺乏声望点数。


1
这个答案可以通过添加items += [ax.get_xaxis().get_label(), ax.get_yaxis().get_label()]来扩展文本标签。在我添加之前它们被截断了。 - Erotemic
我收到了 AttributeError: 'FigureCanvasAgg' 对象没有属性 'renderer' 的错误。 - sds
@sds fig.canvas.get_renderer() 是有效的。 - J. Choi

网页内容由stack overflow 提供, 点击上面的
可以查看英文原文,
原文链接