当我在Jupyter Notebook中使用matplotlib时,总是出现“matplotlib当前正在使用非GUI后端”的错误?

79
import matplotlib.pyplot as pl
%matplot inline
def learning_curves(X_train, y_train, X_test, y_test):
""" Calculates the performance of several models with varying sizes of training data.
    The learning and testing error rates for each model are then plotted. """

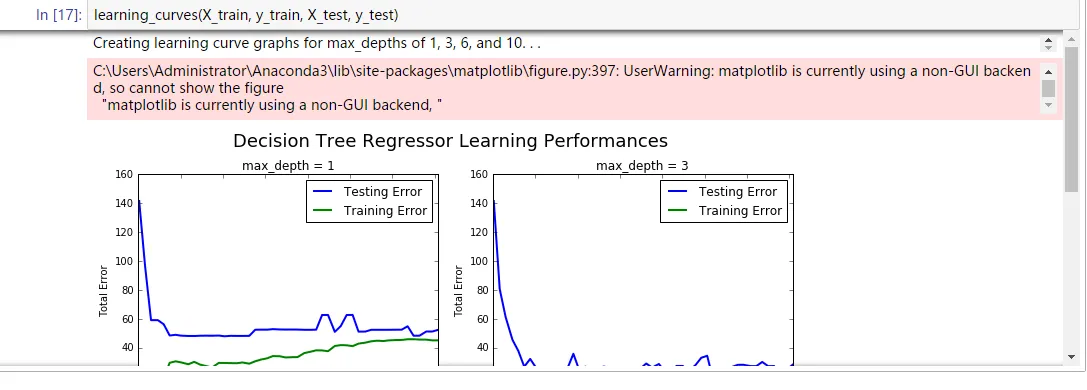
print ("Creating learning curve graphs for max_depths of 1, 3, 6, and 10. . .")

# Create the figure window
fig = pl.figure(figsize=(10,8))

# We will vary the training set size so that we have 50 different sizes
sizes = np.rint(np.linspace(1, len(X_train), 50)).astype(int)
train_err = np.zeros(len(sizes))
test_err = np.zeros(len(sizes))

# Create four different models based on max_depth
for k, depth in enumerate([1,3,6,10]):

    for i, s in enumerate(sizes):

        # Setup a decision tree regressor so that it learns a tree with max_depth = depth
        regressor = DecisionTreeRegressor(max_depth = depth)

        # Fit the learner to the training data
        regressor.fit(X_train[:s], y_train[:s])

        # Find the performance on the training set
        train_err[i] = performance_metric(y_train[:s], regressor.predict(X_train[:s]))

        # Find the performance on the testing set
        test_err[i] = performance_metric(y_test, regressor.predict(X_test))

    # Subplot the learning curve graph
    ax = fig.add_subplot(2, 2, k+1)

    ax.plot(sizes, test_err, lw = 2, label = 'Testing Error')
    ax.plot(sizes, train_err, lw = 2, label = 'Training Error')
    ax.legend()
    ax.set_title('max_depth = %s'%(depth))
    ax.set_xlabel('Number of Data Points in Training Set')
    ax.set_ylabel('Total Error')
    ax.set_xlim([0, len(X_train)])

# Visual aesthetics
fig.suptitle('Decision Tree Regressor Learning Performances', fontsize=18, y=1.03)
fig.tight_layout()
fig.show()

当我运行learning_curves()函数时,它会显示:

UserWarning:C:\Users\Administrator\Anaconda3\lib\site-packages\matplotlib\figure.py:397: UserWarning: matplotlib当前正在使用非GUI后端,因此无法显示图像

这是截图


2
你使用的matplotlib版本是什么?您可以使用 import matplotlibprint(matplotlib.__version__) 进行检查。 - cel
1.5.1,最新版本。 - Yuhao Li
7
加入"%pylab inline"可以让我正常运行。 - Cybernetic
没有一个解决方案适用于我。Matplotlib版本为3.0.3。 - AlwaysLearning
如果您只是在使用 Jupyter 进行编码,而不是用于生产环境,请忽略它。在 Jupyter 之外,它将消失。 - NoName
3
正确答案虽然没有解释得很清楚,但是在 https://dev59.com/UVoU5IYBdhLWcg3wg3So#52827912 上 - 使用 pl.show() 而不是 fig.show() - beldaz
13个回答

93

您不需要使用fig.show()这一行代码。只需将其删除即可,这样就不会出现警告信息。


14
不会有警告讯息,但怎样才能看到这个图形呢?我正在使用 Pycharm,在没有 fig.show() 的情况下执行程序不会显示图表。请问有什么解决方法? - SKR
5
如果一个Jupyter笔记单元格的最后一个对象是一个图形,那么Jupyter会尝试渲染它。如果你有多个图形或其他输出,并且省略了fig.show(),那么你将看不到你的图形。请注意,这里的“图形”指的是使用Matplotlib等库创建的可视化图表。 - Dave X
4
换句话说,一种选择是将最后一行简单地设置为 fig - Matt VanEseltine
beforelongbefore的回答使用IPython.display更好,因为它可以在一个单元格中处理多个图形。 - Marius Wallraff
1
@SKR 将你的最后一行改为 fig.tight_layout() - Hadij

54

在导入时添加%matplotlib inline可以帮助在笔记本中绘制平滑的图表。

%matplotlib inline
import matplotlib.pyplot as plt

%matplotlib inline将matplotlib的后端设置为“inline”后端: 使用此后端,绘图命令的输出将在类似Jupyter笔记本这样的前端中直接显示在产生它的代码单元格下方。然后,生成的绘图也将存储在笔记本文档中。


这在PyCharm 2019.1+中的新jupyter实现中特别有效。 - Holger Brandl
2
谢谢。我在安装和使用Pandas Profiling进行图形处理后遇到了问题。只需使用“%matplotlib inline”一次即可解决我的Jupyter笔记本的问题。 - user96265

28

您可以通过包含以下内容来更改matplotlib使用的后端:

import matplotlib
matplotlib.use('TkAgg')

在你的第一行代码import matplotlib.pyplot as pl之前,请确保先设置好backend。详见这个答案

(虽然还有其他后端选项,但当我遇到类似问题时,将后端更改为TkAgg对我有效)


14

2
%matplotlib notebook 提供了交互式、可平移和可缩放的图形。 - Dave X
这对我有用!谢谢!我只需要用于验证目的,不需要在生产中使用图表,所以这对我很有效。 - Ankushi Sharma

11

您仍然可以通过fig.savefig()保存该图形。

如果您想在网页上查看它,可以尝试

from IPython.display import display
display(fig)

2
这个有效,与上面的注释一样,在单元格的最后一行使用 fig - SpinUp __ A Davis
没错,但这个更好,因为它可以在一个单元格中处理多个数字。 - Marius Wallraff

10
我试图制作类似于Towards Data Science Tutorial的三维聚类。我最初认为fig.show()可能是正确的,但收到了相同的警告...... 简要查看了Matplot3d.. 但然后我尝试使用plt.show(),它完全按照我的预期显示了我的三维模型。我想这也是有道理的。这相当于您的pl.show()
使用Python 3.5和Jupyter Notebook

2
你能否编辑你的回答,解释如何解决问题,而不是解释你经历的过程?你还应该考虑查看如何回答文章以备将来之需 :) - Marcello B.

10

只需输入fig而不是fig.show()


7
当我尝试使用命令fig.show()显示图表时,出现了“matplotlib当前正在使用非GUI后端”的错误。 我发现在Jupyter Notebook中,必须将fig, ax = plt.subplots()和绘图命令放在同一个单元格中,才能呈现图表。
例如,以下代码将成功地在Out [5]中显示条形图:

In [3]:

import matplotlib.pyplot as plt
%matplotlib inline

在 [4]:

x = 'A B C D E F G H'.split()
y = range(1, 9)

在 [5]:

fig, ax = plt.subplots()
ax.bar(x, y)

Out[5]:(包含8个艺术家的容器对象)

成功的柱状图输出

另一方面,以下代码将不会显示图形:

In [5]:

fig, ax = plt.subplots()

输出[5]:

只有边框的空图

输入[6]:

ax.bar(x, y)

Out[6]:(一个包含8个元素的容器对象)

在Out[6]中只有一个声明“一个包含8个元素的容器对象”,但没有显示任何条形图。


2
我遇到了同样的错误。然后我使用了
import matplotlib
matplotlib.use('WebAgg')

它运行得很好。(您需要安装tornado才能在Web上查看,pip install tornado

Python版本:3.7 matplotlib版本:3.1.1


0

如果您使用了像pandas_profiling这样的任何分析库,请尝试将其注释掉并执行代码。在我的情况下,我正在使用pandas_profiling为样本训练数据生成报告。注释掉导入pandas_profiling有助于解决我的问题。


网页内容由stack overflow 提供, 点击上面的
可以查看英文原文,
原文链接