在Jupyter Notebook中隐藏Matplotlib描述
38
- Salvador Dali
1
1https://dev59.com/Al8e5IYBdhLWcg3wZpvw - Luis
2个回答
75
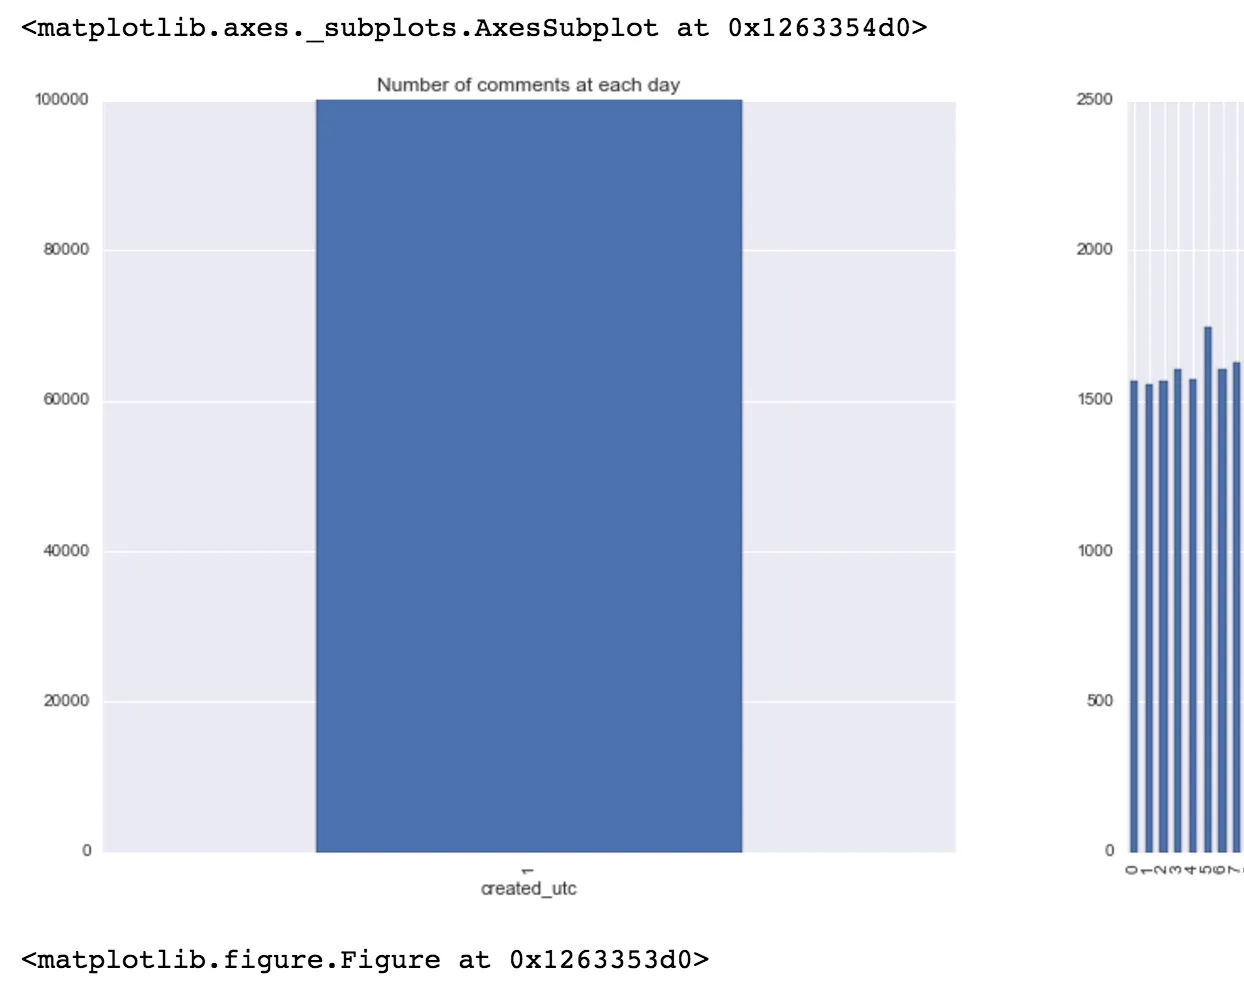
您可以在相应的(matplotlib)代码行末尾加上分号;来完成该行。
- Luis
2
3也适用于
seaborn:sns.lineplot(data=data, palette="tab10", linewidth=2.5); - silkfire4多么出色的回答! - rohaldb
15
这是一个折中方案,但它应该可以始终正常工作:
1. 将绘图函数分配到一个变量中(如果以后需要访问一些绘图元素,这也可能很有用)
plt.figure(figsize=(3, 3))

plot = plt.plot(range(10),
                [x*x for x in range(10)],
                'o-')
2. 在单元格底部添加“pass”(或等效的操作,没有任何后果)
plt.figure(figsize=(3, 3))

plt.plot(range(10),
         [x*x for x in range(10)],
         'o-')
pass
3. 在最后一个语句的结尾添加一个分号
plt.figure(figsize=(3, 3))

plt.plot(range(10),
         [x*x for x in range(10)],
         'o-');
- mgalardini
网页内容由stack overflow 提供, 点击上面的可以查看英文原文,
原文链接
原文链接
- 相关问题
- 6 Matplotlib: 在Jupyter notebook中,figimage无法显示
- 5 jupyter中运行"%matplotlib notebook"无法显示图形
- 11 如何在Jupyter Notebook中绘图时隐藏Matplotlib输出的线条?
- 5 %matplotlib inline与%matplotlib notebook在PythonAnywhere Jupyter中的显示问题
- 8 在Jupyter Notebook中隐藏单元格标签面板
- 3 [Matplotlib]: 在 Jupyter Notebook 中使用 ginput
- 25 Jupyter Notebook 中无法显示 matplotlib 图片
- 5 在Jupyter Notebook中交互式的matplotlib图表
- 5 在Jupyter iPython Notebook中使用matplotlib绘制图表
- 39 在Jupyter Notebook中先使用%matplotlib inline,再使用%matplotlib notebook无法正常工作。
