如何在 Plotly express 中将团队名称(x 轴)旋转 90°?它们没有以正确的方式旋转。
以下是我的代码。
以下是我的代码。
fig = px.bar(stacked_ratio, y="percent", x="team", color="outcome",
             color_discrete_map=colors, title="Long-Form Input")
fig.show()
这是它的外观: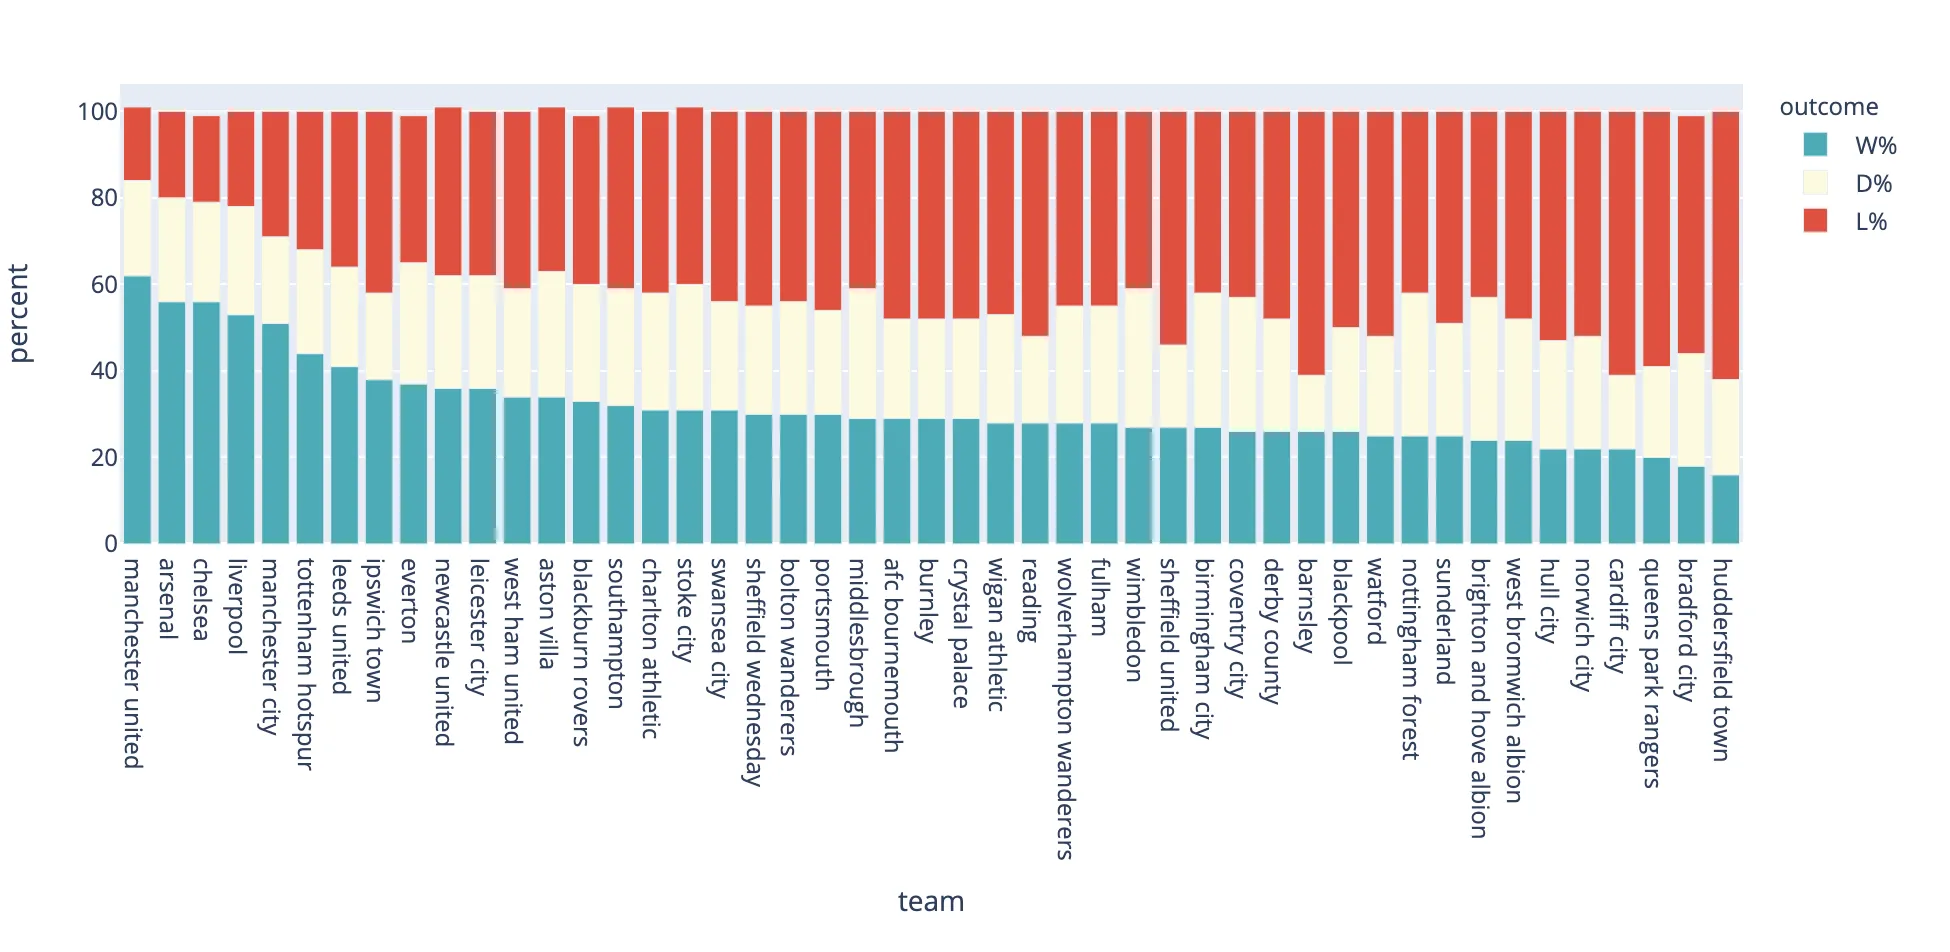
tickangle = 45,但这只是个人口味问题。 - rocarvaj