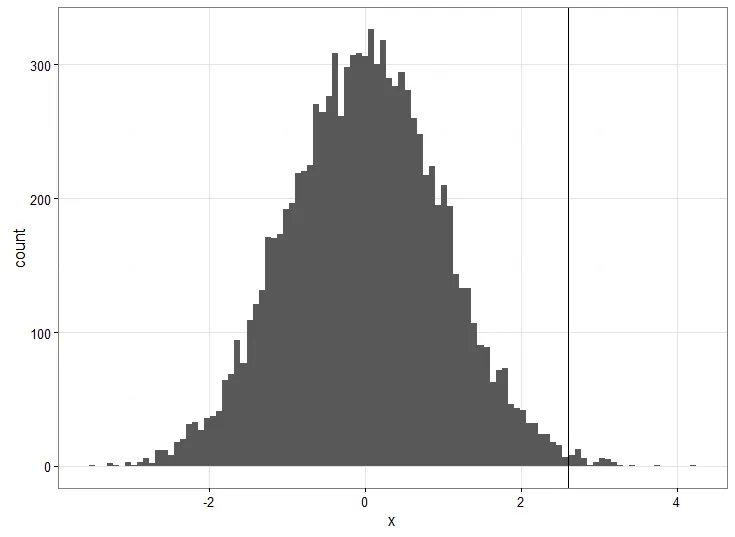
我想在不重新生成现有标签的情况下,为来自geom_vline层的数据添加x轴标签:
library(dplyr)
library(ggplot2)

data_frame(x = rnorm(10000)) %>%
  ggplot(aes(x = x)) +
  geom_histogram(bins = 100) +
  geom_vline(aes(xintercept = mean(x) + 2.6)) +
  theme_bw()
我想在不重新生成现有标签的情况下,为来自geom_vline层的数据添加x轴标签:
library(dplyr)
library(ggplot2)
data_frame(x = rnorm(10000)) %>%
ggplot(aes(x = x)) +
geom_histogram(bins = 100) +
geom_vline(aes(xintercept = mean(x) + 2.6)) +
theme_bw()
library(dplyr)
library(ggplot2)

data_frame(x = rnorm(10000)) %>%
  ggplot(aes(x = x)) +
  geom_histogram(bins = 100) +
  geom_vline(aes(xintercept = mean(x) + 2.6)) +
  theme_bw() +
  geom_text(aes(x=mean(x) + 2.6, label="My label text", y=0), colour="blue", angle=90)
geom_text与现有标签对齐以达到外观效果。 - tchakravarty